
Reasoning about Rates: Overlapping Squares
Loading the math board and drawing, please wait…
In collections
Functions on the Domain of Space - Polygons
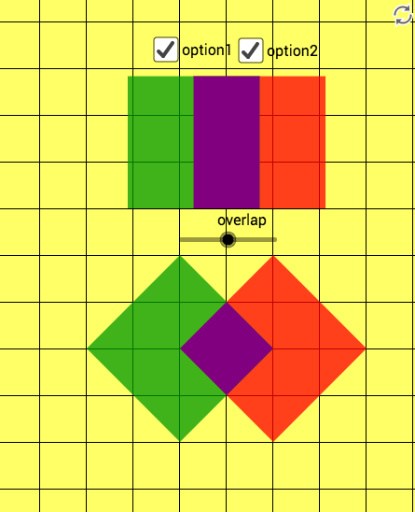
This GeoGebra example demonstrates how to reason about rates of change using two overlapping squares. It visualizes how the area of overlap varies as one square moves or resizes, linking geometric intuition to the concept of instantaneous rate of change. Core mathematical concepts include area, rate of change, and geometric transformations such as reflection and intersection. The construction uses Polygon to define the squares, Mirror to create symmetric copies, Intersect to find overlapping vertices, and a slider (button1) to animate the motion. Suitable for high school or introductory college students exploring derivatives and dynamic geometry, this example serves as a hands-on tool for understanding how geometric quantities change over time.
GeoGebra Commands & Parameters
Polygon(A, B, C, D) → poly1, a, b, c, dMirror(A, yAxis) → A'Mirror(B, yAxis) → B'Mirror(C, yAxis) → C'Mirror(D, yAxis) → D'Polygon(A', B', C', D') → poly1', a', b', c', d'Intersect(b', b) → EIntersect(c, c') → FPolygon(C', E, C, F) → poly2, c'_1, e, c_1, fPolygon(H, I, K, J) → poly3, h_1, i, k, jMirror(H, yAxis) → H'Mirror(I, yAxis) → I'Mirror(K, yAxis) → K'Mirror(J, yAxis) → J'Polygon(H', I', K', J') → poly3', h', i', k', j'Polygon(J', K', K, J) → poly4, j'_1, k'_1, k_1, j_1
AI Drawing Prompt Reference
Draw two squares symmetric about the vertical axis, with the right square being the mirror image of the left. They overlap partially, and their intersection forms a quadrilateral whose vertices are the crossing points of their sides. Then draw two smaller squares also symmetric about the vertical axis, overlapping to create another quadrilateral. All squares have straight edges, and the overall composition shows symmetry and overlapping regions. Include a slider to animate motion or changes.
The prompt above was compiled from the original drawing commands and is for reference only.