
Rational Numbers and Scatter Plot
Loading the math board and drawing, please wait…
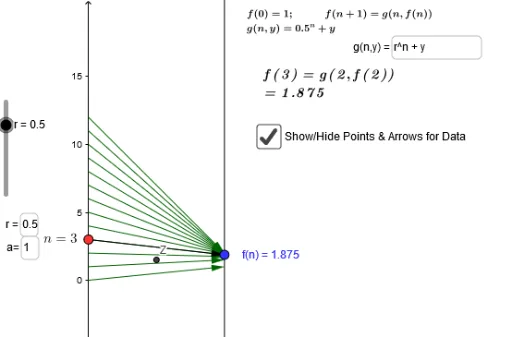
This example demonstrates the concept of rational numbers and presents it through a scatter plot. Core mathematical concepts include rational numbers, standard deviation, and indefinite integral. Using GeoGebra commands such as Point, Vector, and Sequence, a scatter plot of rational numbers can be constructed, and its standard deviation can be calculated. Suitable for high school mathematics education and learning.
GeoGebra Commands & Parameters
Point(yAxis) → AVector(A, B) → uSequence(Vector[(0, x(Element[list1, j])), (2, y(Element[list1, j]))], j, 1, 13) → list2Textfield(r) → inputBox1Textfield(a) → inputBox2Textfield(g) → InputBox1