
Ratio Visualizer
Loading the math board and drawing, please wait…
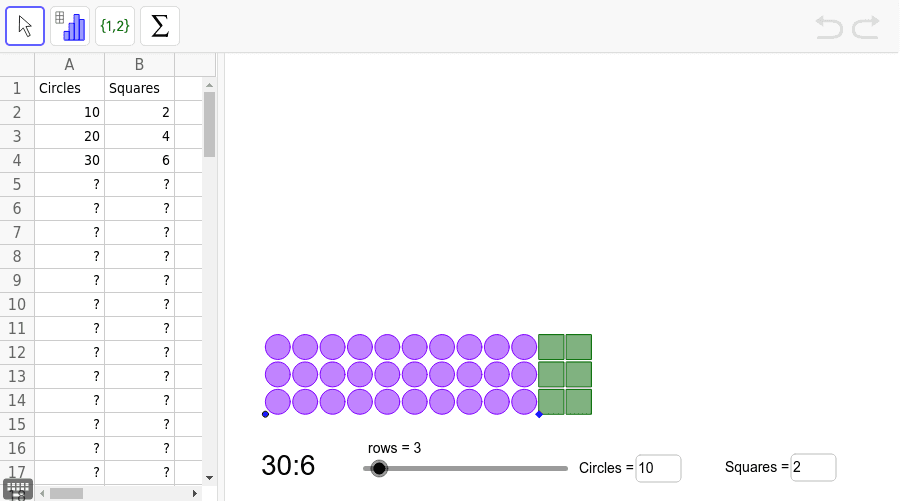
This example demonstrates ratio relationships by moving arrays and generating ratio tables. It uses GeoGebra commands such as Sequence, Textfield, If, and Max, suitable for middle school and above students to learn ratios and sequences.
GeoGebra Commands & Parameters
Sequence(Curc[A + ((i * 0.55), 0)], i, 0, C - 1) → list1Sequence(Translate[list1, Vector[(i * (0, 0.55))]], i, 0, rows - 1) → list2Sequence(Polygon[B + ((i * 0.55), 0), B + ((i * 0.55) + 0.5, 0), 4], i, 0, S - 1) → list3Sequence(Translate[list3, Vector[(i * (0, 0.55))]], i, 0, rows - 1) → list4Textfield(C) → inputBox1Textfield(S) → inputBox2If(Row[B2] ≤ rows, (Row[B2] * S)) → B3If(Row[B3] ≤ rows, (Row[B3] * S)) → B4If(Row[B4] ≤ rows, (Row[B4] * S)) → B5If(Row[B5] ≤ rows, (Row[B5] * S)) → B6If(Row[B6] ≤ rows, (Row[B6] * S)) → B7If(Row[B7] ≤ rows, (Row[B7] * S)) → B8If(Row[B8] ≤ rows, (Row[B8] * S)) → B9If(Row[B9] ≤ rows, (Row[B9] * S)) → B10If(Row[B10] ≤ rows, (Row[B10] * S)) → B11If(Row[B11] ≤ rows, (Row[B11] * S)) → B12If(Row[B12] ≤ rows, (Row[B12] * S)) → B13If(Row[B13] ≤ rows, (Row[B13] * S)) → B14If(Row[B14] ≤ rows, (Row[B14] * S)) → B15If(Row[B15] ≤ rows, (Row[B15] * S)) → B16If(Row[B16] ≤ rows, (Row[B16] * S)) → B17If(Row[B17] ≤ rows, (Row[B17] * S)) → B18If(Row[B18] ≤ rows, (Row[B18] * S)) → B19If(Row[B19] ≤ rows, (Row[B19] * S)) → B20If(Row[B20] ≤ rows, (Row[B20] * S)) → B21If(Row[B21] ≤ rows, (Row[B21] * S)) → B22If(Row[B22] ≤ rows, (Row[B22] * S)) → B23If(Row[B23] ≤ rows, (Row[B23] * S)) → B24If(Row[B24] ≤ rows, (Row[B24] * S)) → B25If(Row[B25] ≤ rows, (Row[B25] * S)) → B26If(Row[B26] ≤ rows, (Row[B26] * S)) → B27If(Row[B27] ≤ rows, (Row[B27] * S)) → B28If(Row[B28] ≤ rows, (Row[B28] * S)) → B29If(Row[B29] ≤ rows, (Row[B29] * S)) → B30Max(6, y(A) + (0.55 * rows)) → ymaxIf(Row[A2] ≥ rows, (Row[A2] * C)) → aIf(Row[A2] ≤ rows, (Row[A2] * C)) → A3If(Row[A3] ≤ rows, (Row[A3] * C)) → A4If(Row[A4] ≤ rows, (Row[A4] * C)) → A5If(Row[A5] ≤ rows, (Row[A5] * C)) → A6If(Row[A6] ≤ rows, (Row[A6] * C)) → A7If(Row[A7] ≤ rows, (Row[A7] * C)) → A8If(Row[A8] ≤ rows, (Row[A8] * C)) → A9If(Row[A9] ≤ rows, (Row[A9] * C)) → A10If(Row[A10] ≤ rows, (Row[A10] * C)) → A11If(Row[A11] ≤ rows, (Row[A11] * C)) → A12If(Row[A12] ≤ rows, (Row[A12] * C)) → A13If(Row[A13] ≤ rows, (Row[A13] * C)) → A14If(Row[A14] ≤ rows, (Row[A14] * C)) → A15If(Row[A15] ≤ rows, (Row[A15] * C)) → A16If(Row[A16] ≤ rows, (Row[A16] * C)) → A17If(Row[A17] ≤ rows, (Row[A17] * C)) → A18If(Row[A18] ≤ rows, (Row[A18] * C)) → A19If(Row[A19] ≤ rows, (Row[A19] * C)) → A20If(Row[A20] ≤ rows, (Row[A20] * C)) → A21If(Row[A21] ≤ rows, (Row[A21] * C)) → A22If(Row[A22] ≤ rows, (Row[A22] * C)) → A23If(Row[A23] ≤ rows, (Row[A23] * C)) → A24If(Row[A24] ≤ rows, (Row[A24] * C)) → A25If(Row[A25] ≤ rows, (Row[A25] * C)) → A26If(Row[A26] ≤ rows, (Row[A26] * C)) → A27If(Row[A27] ≤ rows, (Row[A27] * C)) → A28If(Row[A28] ≤ rows, (Row[A28] * C)) → A29If(Row[A29] ≤ rows, (Row[A29] * C)) → A30If(Row[A30] ≤ rows, (Row[A30] * C)) → A31If(Row[A31] ≤ rows, (Row[A31] * C)) → A32If(Row[B30] ≤ rows, (Row[B30] * S)) → B31If(Row[B31] ≤ rows, (Row[B31] * S)) → B32
AI Drawing Prompt Reference
Create a visual representation of ratio relationships by moving arrays and generating ratio tables. First, draw two sets of parallel squares with fixed spacing between them, controlled by a slider for the number and spacing of squares. Then, add text boxes to input ratio values and display the ratio table based on the input. Finally, combine all graphical elements to form a clear visual demonstration of ratio relationships.
The prompt above was compiled from the original drawing commands and is for reference only.