
Rate of Change with Limits: Visualizing Tangent Slope and Derivative
Loading the math board and drawing, please wait…
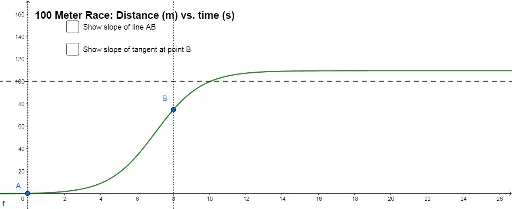
① This example dynamically shows how a secant line approaches a tangent line as a point moves closer to another on a curve, illustrating the concept of instantaneous rate of change (derivative) via limits. ② Core mathematical concepts include limits, rate of change, tangent slope, derivative, and linear approximation, with geometric interpretations of secant and tangent lines. ③ Construction highlights: using GeoGebra commands such as Point, Line, Tangent, Slope, Intersect, and OrthogonalLine, the curve f is built with movable points A and B; the secant line g and tangent line h are generated, and the slopes m (secant) and m_1 (tangent) are displayed numerically, with text1 explaining the limiting process. ④ Suitable for senior high school or introductory college calculus students, this interactive tool helps grasp the geometric meaning of the derivative and can be used for classroom demonstrations or self-study.
GeoGebra Commands & Parameters
Point(f) → APoint(f) → BLine(A, B) → gTangent(B, f) → hSlope(g) → mSlope(h) → m_1Intersect(f, p, (10.05034, 99.9999944101272)) → DOrthogonalLine(D, p) → iOrthogonalLine(B, p) → jOrthogonalLine(A, p) → l
AI Drawing Prompt Reference
Draw a dynamic curve showing how a secant line approaches a tangent line as its two points move closer, illustrating the concept of instantaneous rate of change (derivative). Display the slopes of the secant and tangent lines, and annotate to explain the limiting process where the secant slope approaches the tangent slope.
The prompt above was compiled from the original drawing commands and is for reference only.