
Random Geometry with Sectors: Estimating Probabilities via Angular Regions
Loading the math board and drawing, please wait…
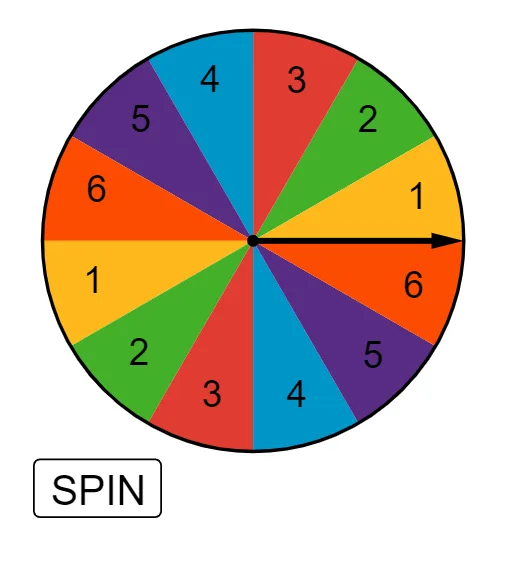
This example demonstrates how to estimate a probability by using random sampling within a geometric setting and counting how often outcomes fall into a specific sector (or subregion). It visualizes the frequency-based viewpoint of probability through a geometric probability model: generate random trials, test membership in the chosen circular sector, and convert the observed proportion into an estimated probability. Key math ideas include probability & statistics (simulation/frequency estimation), circular geometry and area-based reasoning, and angle parameterization linked to trigonometric relationships (e.g., measuring boundaries using trigonometric angle units). In the GeoGebra construction, Intersect and Circle are used to form the relevant circle geometry and intersection points; CircleSector builds the target sector region; Random generates the stochastic trials; Text labels key quantities. The setup also uses angle/Rad-style angular measures and sector partitioning (Sections and related labeled sector/range objects) to create a clear “random trial → region test → statistical result” workflow. Suitable for middle and high school instruction on probability and geometry, and for classroom investigation or exploratory learning.
GeoGebra Commands & Parameters
Intersect(xAxis, yAxis) → ACircle(A, 1) → cCircleSector(A, B, C) → dCircleSector(A, C, D) → eCircleSector(A, D, E) → fCircleSector(A, E, F) → gCircleSector(A, F, G) → hCircleSector(A, G, H) → kCircleSector(A, H, I) → pCircleSector(A, I, J) → qCircleSector(A, J, K) → rRandom(0, 359) → EXCircleSector(A, K, L) → sCircleSector(A, L, M) → tCircleSector(A, M, B) → c_1Text(Value) → resultRandom(1, 2) → lapsCircle(A, N) → d_1
AI Drawing Prompt Reference
On a coordinate plane, draw a circle centered at the origin and partition it into a full set of adjacent sector regions around the center. First define the center as the intersection of the axes, then draw the circle with radius 1. Next, construct a sequence of sector boundaries from the same center so that neighboring sectors share common rays and together cover the whole 360° around the circle. Then create random sample trials by generating random positions in the circular setting; for each sample, test whether it falls inside a chosen specific sector region. Use the observed frequency to form an estimated probability value and display it with a text label, along with the circle/sector reference geometry.
The prompt above was compiled from the original drawing commands and is for reference only.