
Quartiles and Boxplot
Loading the math board and drawing, please wait…
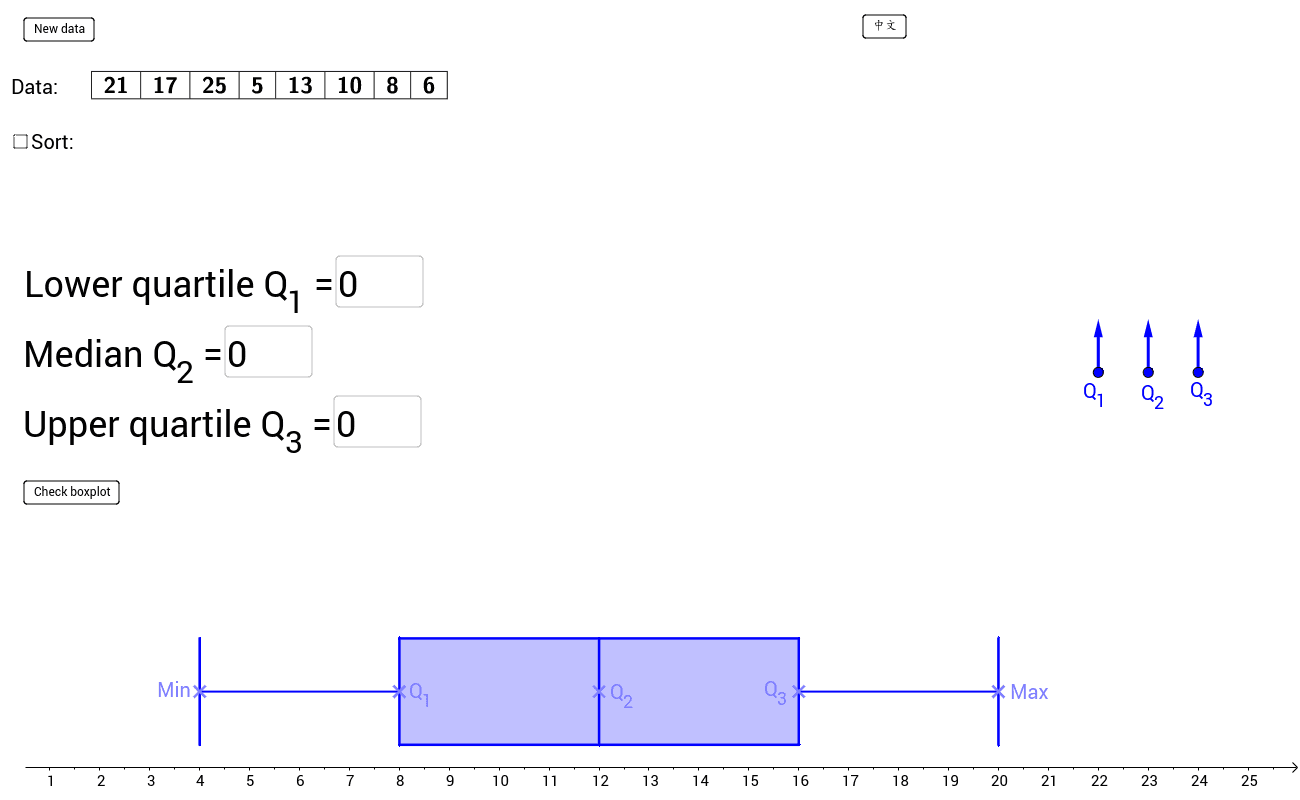
This example demonstrates how to draw a boxplot based on input quartiles (Q1, Q2, Q3). It involves core math concepts like quartiles, data distribution, and boxplot construction methods. Key GeoGebra commands used include Point, Random, Sequence, Sort, and BoxPlot for generating data and plotting. Suitable for high school mathematics teaching, particularly in probability and statistics.
GeoGebra Commands & Parameters
Point(L) → H'Point(L) → G'Point(L) → F'Point(L) → E'Point(L) → D'Random(NumberMin, NumberMax) → nVector(A, A + (0, 1)) → u_1Vector(B, B + (0, 1)) → u_2Vector(C, C + (0, 1)) → u_3Sequence(Random[DataMin, DataMax], i, 1, n) → list1Sort(list1) → list2TableText({list2}, "c|_") → text1TableText({list1}, "c|_") → text2Q1(list2) → Q_1Q3(list2) → Q_3Median(list2) → Q_2Textfield(input1) → inputBox1Textfield(input2) → inputBox2Textfield(input3) → inputBox3DynamicCoordinates(D', round(2 * x(D')) / 2, round(2 * y(D')) / 2) → DDynamicCoordinates(E', round(2 * x(E')) / 2, round(2 * y(E')) / 2) → EDynamicCoordinates(F', round(2 * x(F')) / 2, round(2 * y(F')) / 2) → FDynamicCoordinates(G', round(2 * x(G')) / 2, round(2 * y(G')) / 2) → GDynamicCoordinates(H', round(2 * x(H')) / 2, round(2 * y(H')) / 2) → HSegment(D, E) → sh1Segment(G, H) → sh2Polygon(E + (0, 1), E - (0, 1), G - (0, 1), G + (0, 1)) → boxplot2, a, b, c, dSegment(D - (0, 1), D + (0, 1)) → s1Segment(F - (0, 1), F + (0, 1)) → s3Segment(H - (0, 1), H + (0, 1)) → s5BoxPlot(4, 0.5, list2) → boxplotIf(Chinese, "數據:", "Data:") → text3If(Chinese, "←正確", "←Correct") → text4If(Chinese, "←正確", "←Correct") → text5If(Chinese, "←正確", "←Correct") → text6If(Chinese, "←不正確", "←Incorrect") → text7If(Chinese, "←不正確", "←Incorrect") → text8If(Chinese, "←不正確", "←Incorrect") → text9If(Chinese, "框線圖正確!", "Correct boxplot!") → text10If(Chinese, "部分出錯 ...", "something wrong ...") → text11
AI Drawing Prompt Reference
Draw a boxplot to show data distribution. Generate a set of random data points and calculate the first quartile, third quartile, and median. Connect the quartiles and median with line segments to form the box. Draw horizontal line segments above and below the box to indicate the data range. Finally, label the data points and quartile values next to the boxplot.
The prompt above was compiled from the original drawing commands and is for reference only.