
Qualitative Variable Visualization
Loading the math board and drawing, please wait…
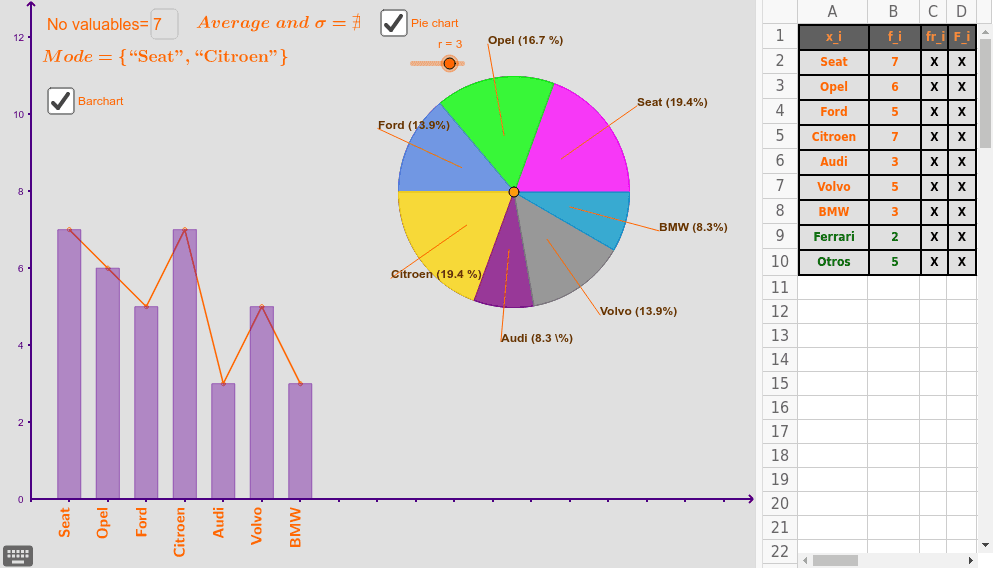
This example demonstrates the distribution of qualitative variables through a bar chart. It involves core mathematical concepts like statistical charts, data visualization, and maximum value calculation. Construction highlights include commands like BarChart, IndexOf, Max, Sequence, Element, RemoveUndefined, Textfield, Circle, Sum, Join, CircleSector, and Text in GeoGebra. Suitable for high school statistics and data visualization education or learning.
GeoGebra Commands & Parameters
Take({A2, A3, A4, A5, A6, A7, A8, A9, A10}, 1, n) → lista1Take({B2, B3, B4, B5, B6, B7, B8, B9, B10}, 1, n) → lista3BarChart(lista1, lista3, 0.6) → aIndexOf(Max[lista3], lista3) → bMax(lista3) → eIndexOf(e, lista3, b + 1) → fIndexOf(e, lista3, 1 + f) → cIndexOf(e, lista3, 1 + c) → dIndexOf(e, lista3, 1 + d) → gIndexOf(e, lista3, 1 + g) → hIndexOf(e, lista3, 1 + h) → iSequence((i, Element[lista3, i]), i, 1, n) → lista5IndexOf(e, lista3, 1 + i) → jIndexOf(e, lista3, 1 + j) → kElement(lista1, b) → texto1Element(lista1, f) → texto2Element(lista1, c) → texto3Element(lista1, d) → texto4Element(lista1, g) → texto5Element(lista1, h) → texto6Element(lista1, i) → texto7Element(lista1, j) → texto8Element(lista1, k) → texto9Take({texto1, texto2, texto3, texto4, texto5, texto6, texto7, texto8, texto9}, 1, n) → lista7RemoveUndefined(lista7) → lista8Textfield(n) → CasillaDeEntrada1Sequence(Segment[Element[lista5, i], Element[lista5, i + 1]], i, 1, n - 1) → lista6Circle(A, r) → pSum(lista3) → lJoin({{0}, lista3}) → lista9Sequence(CircleSector[A, Rotate[B, Sum[((Take[lista9, 1, i] * 2) * π / l)], A], Rotate[B, Sum[((Take[lista9, 1, i + 1] * 2) * π / l)], A]], i, 1, n) → lista4CircleSector(A, Rotate[B, Sum[((Take[lista9, 1, 1] * 2) * π / l)], A], Rotate[B, Sum[((Take[lista9, 1, 2] * 2) * π / l)], A]) → qCircleSector(A, Rotate[B, Sum[((Take[lista9, 1, 2] * 2) * π / l)], A], Rotate[B, Sum[((Take[lista9, 1, 3] * 2) * π / l)], A]) → sCircleSector(A, Rotate[B, Sum[((Take[lista9, 1, 3] * 2) * π / l)], A], Rotate[B, Sum[((Take[lista9, 1, 4] * 2) * π / l)], A]) → tCircleSector(A, Rotate[B, Sum[((Take[lista9, 1, 4] * 2) * π / l)], A], Rotate[B, Sum[((Take[lista9, 1, 5] * 2) * π / l)], A]) → c_1CircleSector(A, Rotate[B, Sum[((Take[lista9, 1, 5] * 2) * π / l)], A], Rotate[B, Sum[((Take[lista9, 1, 6] * 2) * π / l)], A]) → d_1CircleSector(A, Rotate[B, Sum[((Take[lista9, 1, 6] * 2) * π / l)], A], Rotate[B, Sum[((Take[lista9, 1, 7] * 2) * π / l)], A]) → e_1CircleSector(A, Rotate[B, Sum[((Take[lista9, 1, 7] * 2) * π / l)], A], Rotate[B, Sum[((Take[lista9, 1, 8] * 2) * π / l)], A]) → f_1CircleSector(A, Rotate[B, Sum[((Take[lista9, 1, 8] * 2) * π / l)], A], Rotate[B, Sum[((Take[lista9, 1, 9] * 2) * π / l)], A]) → g_1CircleSector(A, Rotate[B, Sum[((Take[lista9, 1, 9] * 2) * π / l)], A], Rotate[B, Sum[((Take[lista9, 1, 10] * 2) * π / l)], A]) → h_1Circle(A, r) → k_1Sequence(Rotate[C, ((Sum[Take[lista9, 1, i]] * 2) * π / l) + (Element[lista9, 1 + i] * π / l), A], i, 1, n) → lista10Text(Element[lista3, 1]) → texto12Sequence(Rotate[D, ((Sum[Take[lista9, 1, i]] * 2) * π / l) + (Element[lista9, 1 + i] * π / l), A], i, 1, n) → lista12Sequence((Element[lista3, i] / l * 100), i, 1, n) → lista11Sequence(Text[Element[lista15, i], Element[lista12, i]], i, 1, n) → lista14Sequence(Segment[Element[lista10, i], Element[lista12, i]], i, 1, n) → lista13Sequence(VerticalText[Element[lista1, i], (i - 0.35, 0)], i, 1, n) → lista2