
Quadratic Functions: Matching Locus of a Constrained Point
Loading the math board and drawing, please wait…
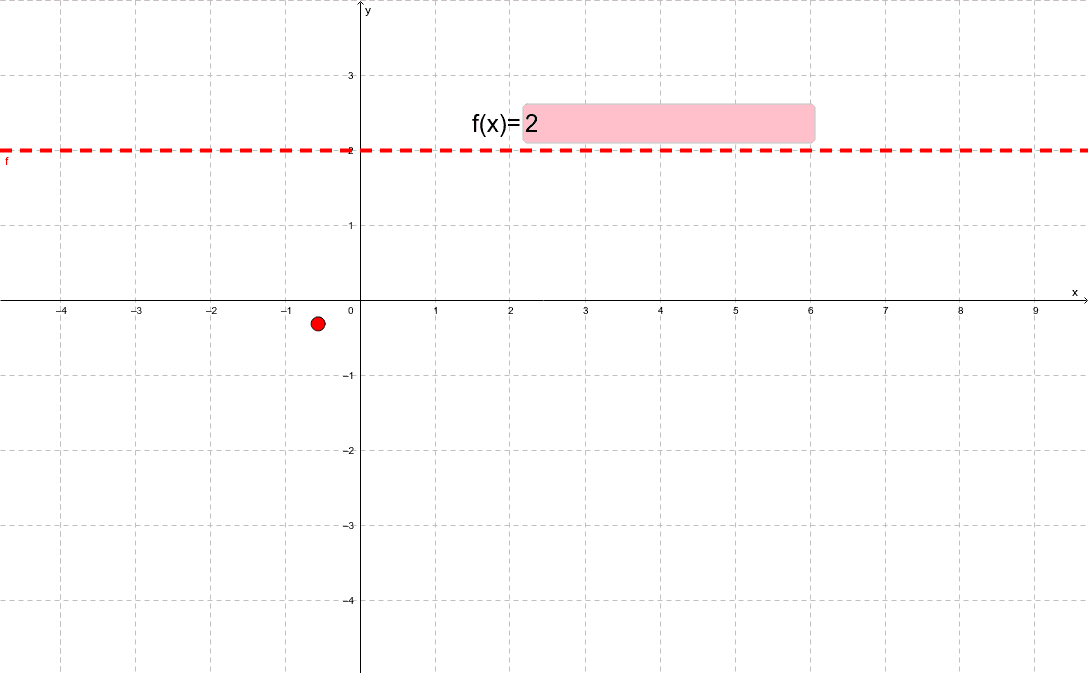
This interactive example demonstrates the relationship between algebraic expressions and their geometric representations by requiring users to match a function's graph to the locus of a constrained point. It covers core mathematical concepts including quadratic functions, locus equations, and coordinate geometry. The construction utilizes the Point command for constrained movement and Textfield (inputBox) for real-time editing of the function f, involving objects c and A to define the geometric constraints. This tool is ideal for high school students and educators focusing on function transformations and the conceptual link between algebra and geometry.
GeoGebra Commands & Parameters
Point(c) → ATextfield(f) → inputBox1
AI Drawing Prompt Reference
Draw the graph of a quadratic function and show the locus of a constrained point. Input a function expression to plot the function graph. Meanwhile, a point moves under specific constraints, and its locus is drawn. The point is constrained by two geometric objects, one of whose positions is determined by the function's parameters. Display the function graph and point locus, labeling key objects and their relationships.
The prompt above was compiled from the original drawing commands and is for reference only.