
Quadratic Functions - Effects of h and k
Loading the math board and drawing, please wait…
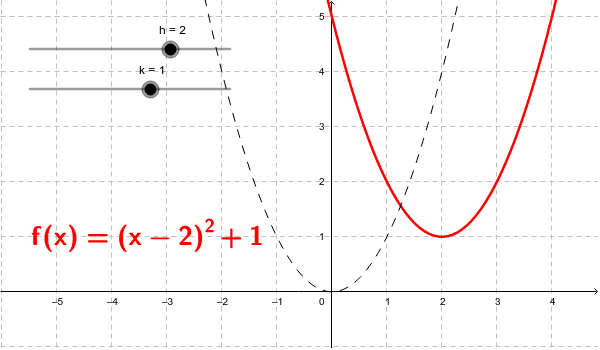
This example demonstrates the changes in the graph of the quadratic function y = a(x - h)² + k, where h and k affect the translation of the function's graph. Key mathematical concepts include the properties and transformations of quadratic functions. By adjusting the values of h and k, one can observe the translation of the graph along the x-axis and y-axis. This example uses GeoGebra's slider animation commands and is suitable for high school mathematics education and learning about quadratic function graph transformations.
GeoGebra Commands & Parameters
Numeric h(2.0)Numeric k(1.0)f(x) = (x - h)^(2) + kConic c