
Quadratic Function Locus Transformation
Loading the math board and drawing, please wait…
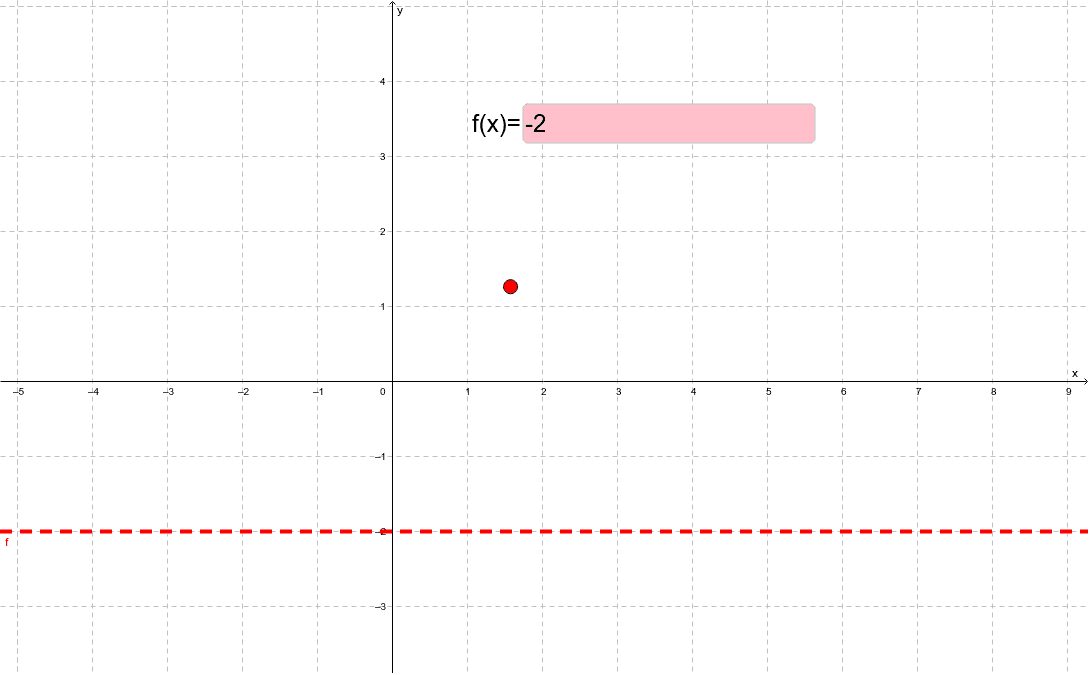
This example demonstrates how students can edit the algebraic expression of a function to match the locus of a constrained point. It involves core math concepts like quadratic functions, locus, coordinate geometry, and parameter transformation. The construction uses GeoGebra commands such as Point and Textfield, along with objects like c, A, f, and inputBox1 for interactive manipulation. Suitable for high school mathematics education to understand the relationship between function graphs and loci and the impact of parameters on function shapes.
GeoGebra Commands & Parameters
Point(c) → ATextfield(f) → inputBox1
AI Drawing Prompt Reference
Draw a parabola graph showing the locus of a point under constraints. Include a parabola curve, a point marker, and a text box to explain the concept. The construction order is to draw the parabola first, then place the point, and finally add the text box to explain the graph.
The prompt above was compiled from the original drawing commands and is for reference only.