
Quadratic Function Graph and Its Roots
Loading the math board and drawing, please wait…
In collections
Quadratic functions
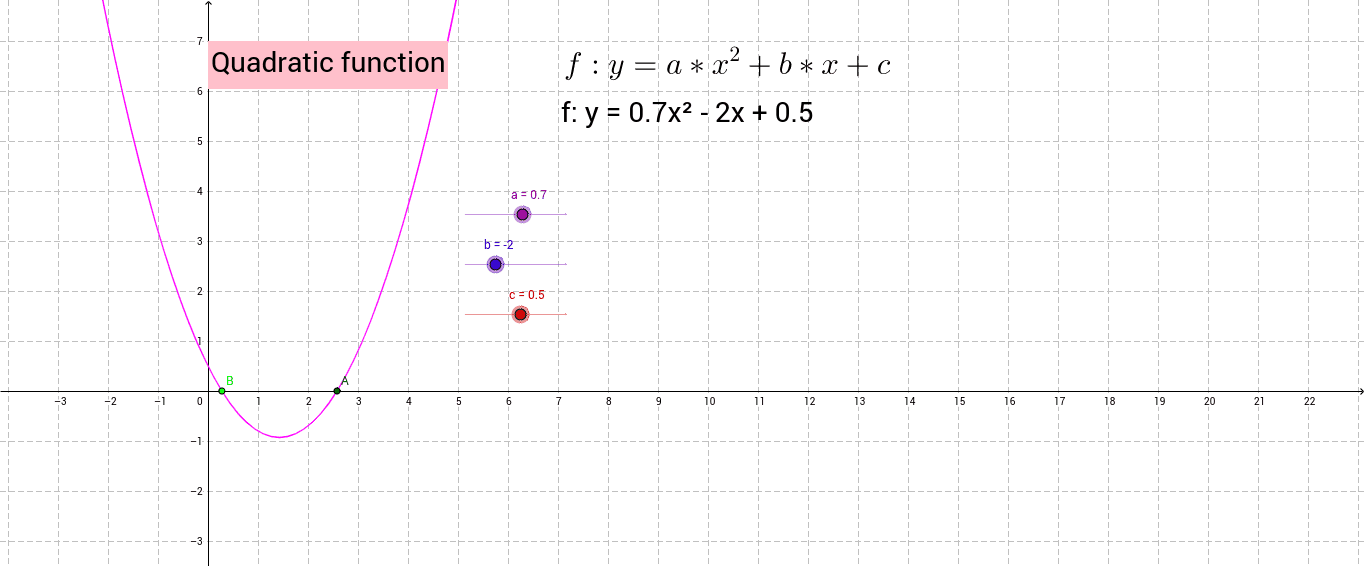
This GeoGebra example demonstrates the geometric relationship between the graph of a quadratic function (a parabola) and its roots, showing that the roots correspond to the intersection points of the parabola with the x-axis. Core mathematical concepts include quadratic functions, parabolas, function zeros/roots, the discriminant and number of real roots, and coordinate geometry. The construction uses the GeoGebra Intersect command on objects a, b, c, f, A, B, Text1, d, Text2, and Text4 to compute intersections between the function graph f and relevant lines, labeling the resulting points A and B as roots with explanatory text. It is suitable for middle school and high school algebra and analytic geometry courses, as well as self-study of quadratic function properties and the geometric meaning of roots.
GeoGebra Commands & Parameters
Intersect(f, xAxis) → A, B
AI Drawing Prompt Reference
Draw the graph of a quadratic function and show its intersection points with the x-axis, which are the roots of the quadratic function. First, draw the graph of the quadratic function, then find the intersection points of the graph with the x-axis and label them as A and B. Add explanatory text on the graph to describe that these points are the roots of the quadratic function.
The prompt above was compiled from the original drawing commands and is for reference only.