
Quadratic Function Derivative and Tangent Slope Exploration with Sliders
Loading the math board and drawing, please wait…
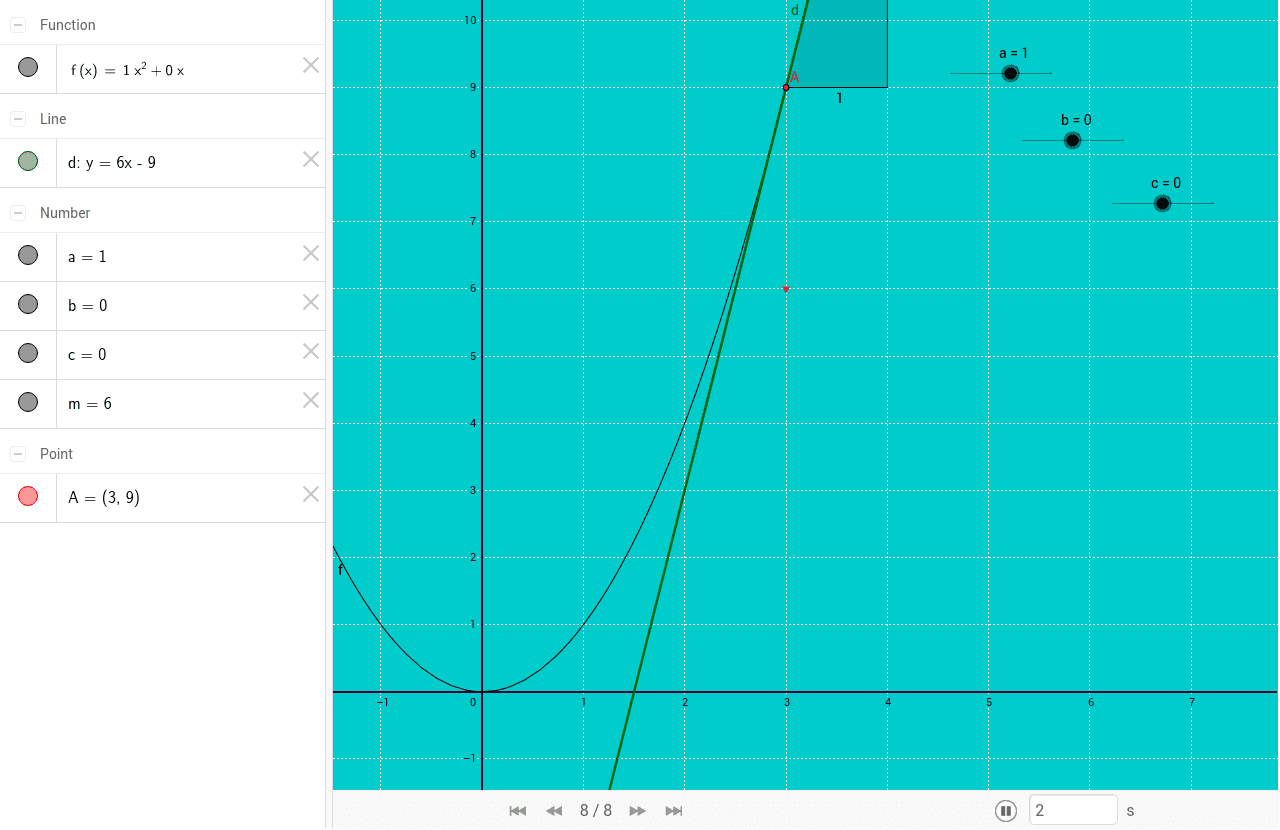
This example presents a quadratic function f(x)=ax^2+bx+c with sliders for the coefficients a, b, and c, and displays a trace of the slope of the tangent line (the first derivative). As the sliders are moved, the graph, its tangent, and the slope value change dynamically. The core mathematical ideas involve quadratic functions, derivatives, tangent lines, and the geometric interpretation of the derivative. In GeoGebra the construction uses the Tangent and Slope commands; objects include sliders a, b, c, the function f, points A, B, and variables d, m, etc. This interactive exploration helps students visualize how the derivative relates to the tangent slope, making it suitable for high‑school or early‑college calculus courses.
GeoGebra Commands & Parameters
Tangent(A, f) → dSlope(d) → m
AI Drawing Prompt Reference
Draw a dynamic quadratic function graph with adjustable sliders for coefficients a, b, and c, and the function f(x)=ax^2+bx+c. Show the slope of the tangent line changing as sliders move, and label the tangent and slope value. Ensure the graph clearly illustrates quadratic functions, derivatives, tangent slope, and geometric interpretation, suitable for math teaching.
The prompt above was compiled from the original drawing commands and is for reference only.