
Quadratic Function Demonstration
Loading the math board and drawing, please wait…
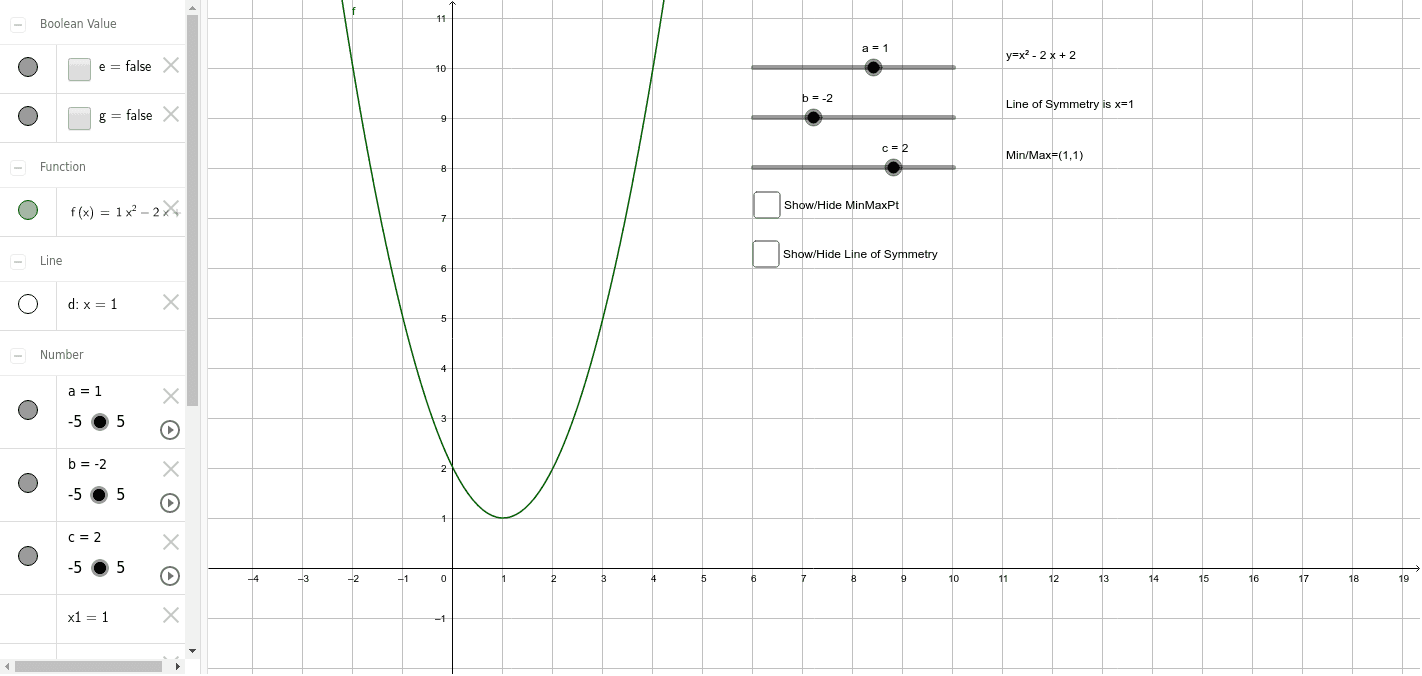
This example dynamically illustrates how the graph of a quadratic function changes with parameters a, b, and c. It involves core math concepts like quadratic functions, vertex coordinates, symmetry axes, linear equations, and boxplots in probability & statistics. GeoGebra commands/objects used include a, b, c, f, x1, y1, M, d, text1, e, g, text3, text2. Suitable for high school mathematics teaching to understand quadratic function properties and parameter effects.
GeoGebra Commands & Parameters
Numeric a(1.0)Numeric b(-2.0)Numeric c(2.0)f(x) = (a * x^(2)) + (b * x) + c((-b)) / ((2 * a))f(x1)(x1, y1)x = x1Boolean e(false)Boolean g(false)
AI Drawing Prompt Reference
Create a dynamic illustration showing how the graph of a quadratic function changes with parameters a, b, c, including the function graph, vertex coordinates, symmetry axis, and linear equations, suitable for high school math teaching with sliders to adjust parameters and observe effects.
The prompt above was compiled from the original drawing commands and is for reference only.