
Proportions in a Table and a Graph
Loading the math board and drawing, please wait…
In collections
Unit 7 Similar Triangles
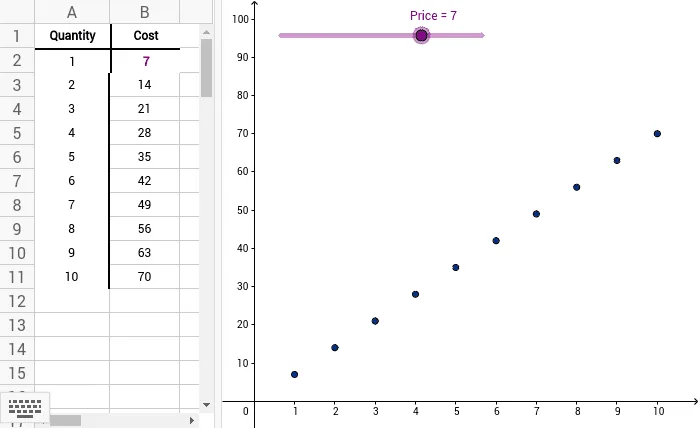
This example demonstrates proportions using a table and a graph. Key mathematical concepts include proportion and arithmetic mean. Using GeoGebra commands such as Price, A2, A3, etc., the table and graph are constructed. Suitable for middle school and above students to learn about proportions and data analysis.
GeoGebra Commands & Parameters
Numeric Price(7)Numeric A2(1)Numeric A3(2)Numeric A4(3)Numeric A5(4)Numeric A6(5)Numeric A7(6)Numeric A8(7)Numeric A9(8)Numeric A10(9)Numeric A11(10)Price(A3 * $B$2)(A4 * $B$2)(A5 * $B$2)(A6 * $B$2)(A7 * $B$2)(A8 * $B$2)(A9 * $B$2)(A10 * $B$2)(A11 * $B$2)(A2, B2)(A3, B3)(A4, B4)(A5, B5)(A6, B6)(A7, B7)(A8, B8)(A9, B9)(A10, B10)(A11, B11){A, B, C, D, E, F, G, H, I, J}
AI Drawing Prompt Reference
Create a table and graph to demonstrate proportionality, with the table containing a series of values and a base value, and the graph plotting points based on the product of these values with the base value to show a linear relationship, first generate the table data, then plot the points to draw the graph, illustrating the concept of proportion and arithmetic mean.
The prompt above was compiled from the original drawing commands and is for reference only.