
Probability Simulation
Loading the math board and drawing, please wait…
In collections
Probability & Intro. to Stat.
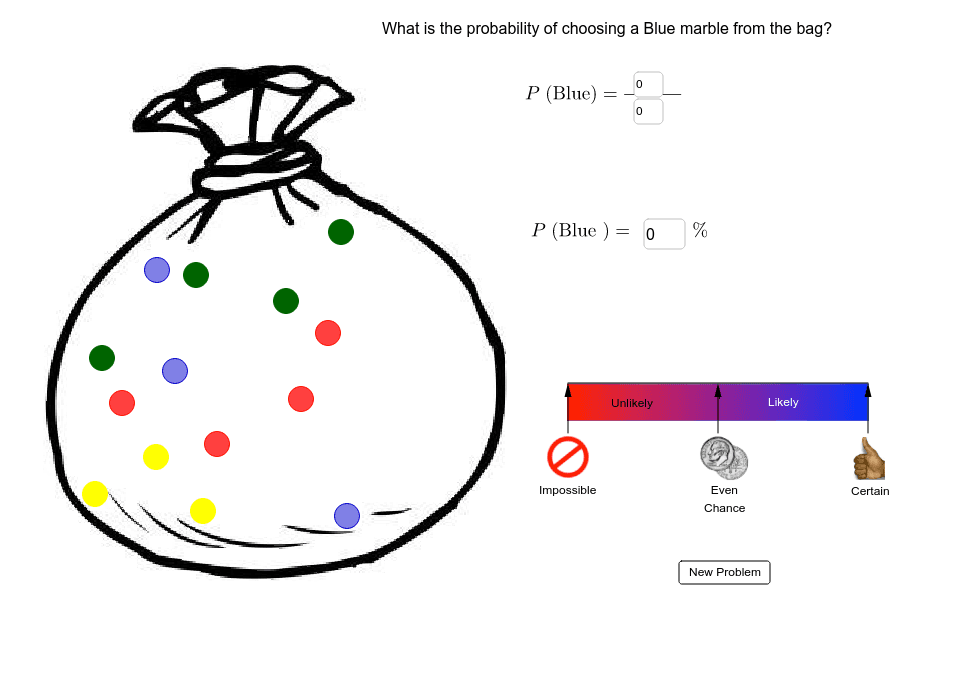
This example demonstrates basic probability concepts, including the hypergeometric distribution. Using GeoGebra commands such as Circle, Element, and Textfield, users can visually understand probability calculations. Suitable for high school math education and students learning probability and statistics.
GeoGebra Commands & Parameters
Circle(G, 0.25) → gCircle(H, 0.25) → hCircle(I, 0.25) → kCircle(J, 0.25) → pCircle(K, 0.25) → qCircle(L, 0.25) → rCircle(M, 0.25) → sCircle(N, 0.25) → tCircle(O, 0.25) → c_1Circle(P, 0.25) → d_1Circle(Q, 0.25) → e_1Circle(R, 0.25) → f_1Circle(S, 0.25) → g_1Circle(T, 0.25) → h_1Circle(U, 0.25) → k_1Circle(V, 0.25) → p_1Circle(W, 0.25) → q_1Circle(Z, 0.25) → r_1Circle(A_1, 0.25) → s_1Circle(B_1, 0.25) → t_1Circle(C_1, 0.25) → c_2Circle(D_1, 0.25) → d_2Circle(E_1, 0.25) → e_2Circle(F_1, 0.25) → f_2Circle(G_1, 0.25) → g_2Circle(H_1, 0.25) → h_2Element(Color, Choose) → text1Textfield(a) → InputBox1Textfield(b) → InputBox2Textfield(Percentage) → InputBox3Circle(G_2, 0.25) → g_3Circle(G_3, 0.25) → g_4Circle(G_4, 0.25) → g_5Circle(G_5, 0.25) → g_6Segment(I_1, J_1) → iMidpoint(i) → K_1Vector(L_1, I_1) → uVector(M_1, K_1) → vVector(N_1, J_1) → wVector(Z_1, W_1) → j