
Probability of Type I and II Errors in Hypothesis Testing
Loading the math board and drawing, please wait…
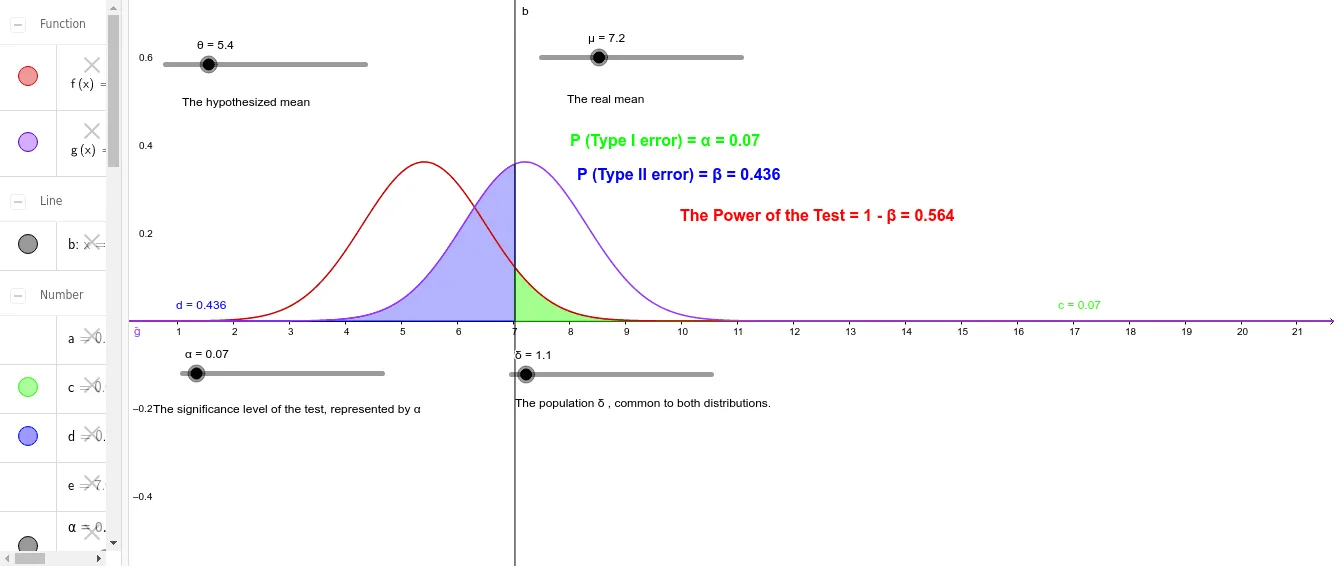
This example demonstrates how to calculate and visualize the probabilities of Type I (α) and Type II (β) errors in hypothesis testing. It involves core mathematical concepts such as probability distributions, normal distributions, integral calculations, significance levels, and test power. The construction leverages GeoGebra commands like InverseNormal, Normal, and Integral, along with objects like α, δ, θ, e, f, μ, g, d, and text elements. It is suitable for high school and above students learning about key hypothesis testing concepts, as well as for statistical teaching demonstrations.
GeoGebra Commands & Parameters
InverseNormal(θ, δ, 1 - α) → eNormal(θ, δ, x) → fNormal(μ, δ, x) → gIntegral(g, -100, e) → dIntegral(f, e, 100) → c
AI Drawing Prompt Reference
Draw the probability graph for Type I (α) and Type II (β) errors in hypothesis testing. First, draw the standard normal distribution curve f. Then, draw the inverse normal distribution curve e at θ and δ. Next, draw the standard normal distribution curve g with mean μ. Calculate the integral d from -100 to e of g, and the integral c from e to 100 of f.
The prompt above was compiled from the original drawing commands and is for reference only.