
Probability Distribution Calculation & Demonstration
Loading the math board and drawing, please wait…
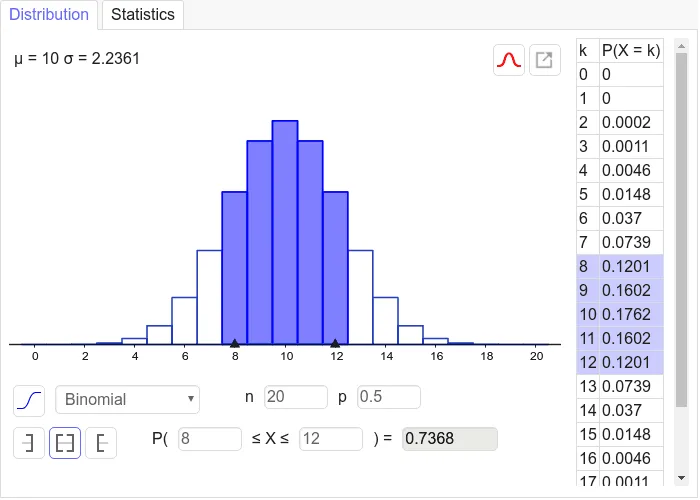
This example demonstrates the calculation and visualization of probability distributions, graphically illustrating their properties. Core math concepts include probability theory, tree diagrams, combinatorics, real number operations, and logarithms. It leverages GeoGebra commands such as Sequence for generating sequences, Min for finding minimum values, and Max for determining maximum values. Suitable for high school and above students to understand the computation methods and applications of probability distributions.
GeoGebra Commands & Parameters
Sequence(20, 20, 0, 20) →Min(x(Point[xAxis]) + 1.5, x(Point[xAxis]) + 1.5) →Max(x(Point[xAxis]) + 1.5, x(Point[xAxis]) + 1.5) →
AI Drawing Prompt Reference
Visualize a probability distribution by plotting a sequence of points along the horizontal axis, marking the start and end positions to illustrate the range and characteristics of the distribution.
The prompt above was compiled from the original drawing commands and is for reference only.