
Probability and Tree Diagram Demo
Loading the math board and drawing, please wait…
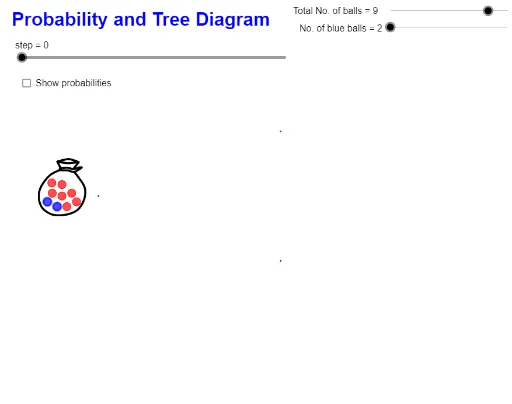
This example demonstrates probability tree diagrams interactively, visually showing how probabilities combine through event occurrences; core math concepts include probability calculation, independence of events, and tree diagram construction; GeoGebra commands used are Sequence, Center, If, Point, and Segment for creating sequences, centering, conditional logic, point placement, and line segment drawing; suitable for high school mathematics teaching, particularly introductory probability & statistics and complex event analysis.
GeoGebra Commands & Parameters
Sequence(Circle[Element[Centre01, i], BallRadius], i, 2, NoB + 1) → BallBlueList01Center(Element[BallBlueList01, 1]) → AASequence(Circle[Element[Centre11, i], BallRadius], i, 2, NoB) → BallBlueList11Sequence(Circle[Element[Centre12, i], BallRadius], i, 2, NoB + 1) → BallBlueList12Sequence(Circle[Element[Centre21, i], BallRadius], i, 2, NoB - 1) → BallBlueList21Sequence(Circle[Element[Centre22, i], BallRadius], i, 2, NoB) → BallBlueList22Sequence(Circle[Element[Centre24, i], BallRadius], i, 2, NoB + 1) → BallBlueList24Sequence(Circle[Element[Centre23, i], BallRadius], i, 2, NoB) → BallBlueList23Sequence(If[step ≤ 10, (FindCor(step, 0, 10, x(Element[Tree01Point, i]), x(Element[Tree02Point, i])), FindCor(step, 0, 10, y(Element[Tree01Point, i]), y(Element[Tree02Point, i]))), Element[Tree02Point, i]], i, 1, 2) → Tree02MovingPointSequence(Segment[Element[Tree01Point, i], Element[Tree02MovingPoint, i]], i, 1, 2) → TreeLine01Sequence(If[step < 35, Element[Tree03Point, i], If[step > 45, Element[Tree04Point, i], (FindCor(step, 35, 45, x(Element[Tree03Point, i]), x(Element[Tree04Point, i])), FindCor(step, 35, 45, y(Element[Tree03Point, i]), y(Element[Tree04Point, i])))]], i, 1, 4) → Tree04MovingPointSequence(Segment[Element[Tree03Point, i], Element[Tree04MovingPoint, i]], i, 1, 4) → TreeLine02If(step < 20, Element[Centre11, NoB + 1], If[step > 30, C11a, (FindCor(step, 20, 30, x(Element[Centre11, NoB + 1]), x(C11a)), FindCor(step, 20, 30, y(Element[Centre11, NoB + 1]), y(C11a)))]) → C11aMoveIf(step < 20, Element[Centre12, NoB + 2], If[step > 30, C12a, (FindCor(step, 20, 30, x(Element[Centre12, NoB + 2]), x(C11a)), FindCor(step, 20, 30, y(Element[Centre12, NoB + 2]), y(C12a)))]) → C12aMoveIf(step < 50, Element[Centre21, NoB], If[step > 60, C21b, (FindCor(step, 50, 60, x(Element[Centre21, NoB]), x(C21b)), FindCor(step, 50, 60, y(Element[Centre21, NoB]), y(C21b)))]) → C21bMoveIf(step < 50, Element[Centre23, NoB + 1], If[step > 60, C23b, (FindCor(step, 50, 60, x(Element[Centre23, NoB + 1]), x(C23b)), FindCor(step, 50, 60, y(Element[Centre23, NoB + 1]), y(C23b)))]) → C23bMoveIf(step < 50, Element[Centre24, NoB + 3], If[step > 60, C24b, (FindCor(step, 50, 60, x(Element[Centre24, NoB + 3]), x(C24b)), FindCor(step, 50, 60, y(Element[Centre24, NoB + 3]), y(C24b)))]) → C24bMoveIf(step < 50, Element[Centre22, nb + 1], If[step > 60, C22b, (FindCor(step, 50, 60, x(Element[Centre22, nb + 1]), x(C22b)), FindCor(step, 50, 60, y(Element[Centre22, nb + 1]), y(C22b)))]) → C22bMoveSequence(Circle[Element[BlueSelectedMovingCentreList, i], BallRadius], i, 1, 1) → BallBlueSelectedList01Sequence(Circle[Element[RedSelectedMovingCentreList, i], BallRadius], i, 2, 5) → BallRedSelectedList02Sequence(Circle[Element[RedSelectedMovingCentreList, i], BallRadius], i, 1, 1) → BallRedSelectedList01Sequence(Circle[Element[BlueSelectedMovingCentreList, i], BallRadius], i, 2, 5) → BallBlueSelectedList02Sequence(Circle[Element[Centre01, i], BallRadius], i, NoB + 2, nb + 1) → BallRedList01Sequence(Circle[Element[Centre11, i], BallRadius], i, NoB + 2, nb + 1) → BallRedList11Sequence(Circle[Element[Centre12, i], BallRadius], i, NoB + 3, nb + 1) → BallRedList12Sequence(Circle[Element[Centre22, i], BallRadius], i, NoB + 2, nb) → BallRedList22Sequence(Circle[Element[Centre23, i], BallRadius], i, NoB + 3, nb + 1) → BallRedList23Sequence(Circle[Element[Centre24, i], BallRadius], i, NoB + 4, nb + 1) → BallRedList24Sequence(Circle[Element[Centre21, i], BallRadius], i, NoB + 2, nb + 1) → BallRedList21Point(tempL11) → Z17Segment(Z17, Z08) → i
AI Drawing Prompt Reference
Draw a probability tree diagram with two initial events, each with two possible outcomes. Event A has blue and red outcomes, and event B has two possible outcomes under each result of A. Use segments to connect each event's outcomes, forming a tree structure. Place circles at each outcome point to represent the probability of the event occurring. As the step changes, the outcome points will move, demonstrating how probabilities combine through event occurrences.
The prompt above was compiled from the original drawing commands and is for reference only.