
Probability and Geometry Interaction: Die Rolling Simulation
Loading the math board and drawing, please wait…
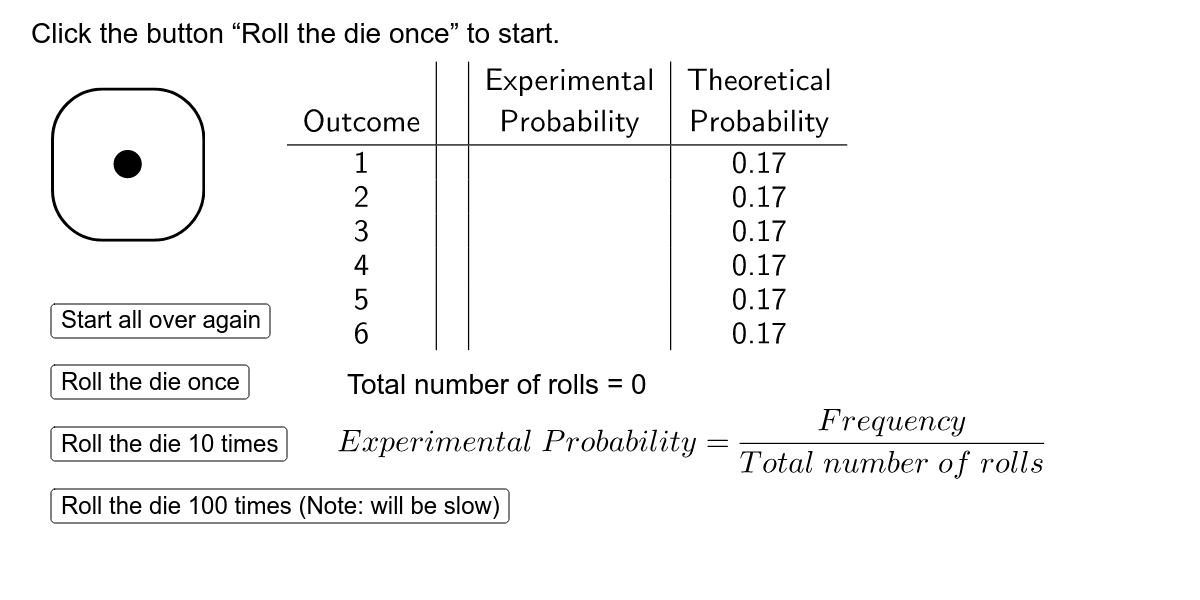
This GeoGebra example simulates rolling a die to illustrate basic probability concepts. Key mathematical concepts include random events, frequency and probability correspondence, and the application of geometric shapes in probability analysis. Construction involves using commands like Random, Frequency, Append to generate data tables, and buttons to control multiple rolls. Suitable for middle school or high school students to understand the integration of probability and geometry, aiding in statistical and geometric visualization.
GeoGebra Commands & Parameters
Random(1, 6) → bFrequency(RollClass, RollResult) → RollFreqAppend("", Append["Frequency", RollFreq]) → ColFreqAppend("Experimental", Append["Probability", RollFreqFrac]) → ColFreqFracTableText({ColFaces, ColFreq, ColFreqFrac, ColTheoProb}, "|01110 _001000000 vc") → text2
AI Drawing Prompt Reference
Create a die rolling simulation to illustrate basic probability concepts. Generate random numbers between 1 and 6, record the frequency of each number, and calculate the experimental probability. Create a table to show the frequency and theoretical probability of each face, as well as the experimental probability.
The prompt above was compiled from the original drawing commands and is for reference only.