
Practice Slope of a Line Segment
Loading the math board and drawing, please wait…
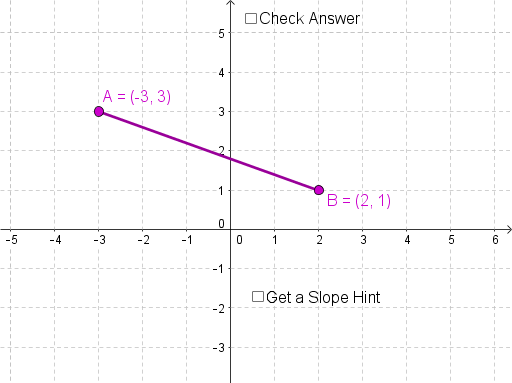
This GeoGebra example provides an interactive practice for calculating the slope of a line segment defined by two points A and B. It visually demonstrates how the slope value (rise over run) relates to the segment's inclination, with a midpoint and slope display. Core mathematical concepts include coordinate geometry, the slope formula, line segments, and vectors. The construction uses the Segment command to create the segment, Midpoint to find its center, and Slope to compute the slope; objects include points A, B, midpoint M, segment s, slope value a, and auxiliary elements like t, d, c, i, j, b, e, g, h, text4, l, and text1, likely for labels or dynamic adjustments. This is suitable for middle school to high school students learning linear functions and coordinate geometry, and can be used for classroom drills or self-study, with random point generation to provide varied practice.
GeoGebra Commands & Parameters
Segment(B, A) → aMidpoint(a) → MSlope(a) → b
AI Drawing Prompt Reference
Draw a line segment defined by two random points, and show its midpoint. Display the slope value of the segment as a text label, calculated as the ratio of vertical change to horizontal change. The figure should include the two endpoints, the connecting segment, a midpoint marker, and a visible slope label. The segment may be slanted, with the midpoint at its center, and the slope value clearly shown.
The prompt above was compiled from the original drawing commands and is for reference only.