
Practice: How Much for One? – Unit Price and Linear Relations
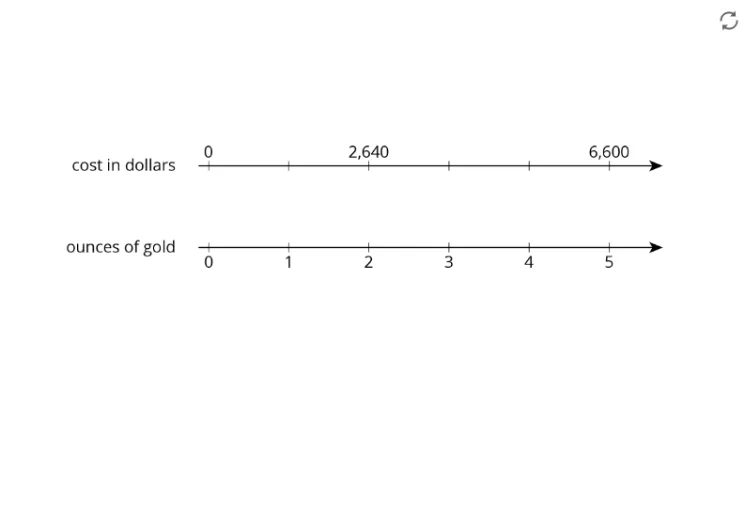
Loading the math board and drawing, please wait…
In collections
Unit 2 Homework: Intro to Ratios
① This example demonstrates how to calculate the unit price from total cost and quantity in a real-life shopping context, using GeoGebra to dynamically show proportional relationships and linear function graphs. ② Core math concepts include ratio, unit price, linear functions, linear equations, and the geometric meaning of slope and intercept, with extensions to exponents and hyperbolas as background topics. ③ Construction highlights: based on the summary, it uses points A, B, and an image object pic1, likely allowing users to drag points or sliders to change quantity and total cost, updating the unit price and plotting the corresponding line to visualize the linear relationship. ④ Suitable for upper elementary to middle school students, this helps grasp the arithmetic concept of 'unit price = total cost ÷ quantity' and transitions to learning linear functions and equations, also useful for classroom demonstrations or self-paced exploration.
GeoGebra Commands & Parameters
Point A(-11.203412387819128, 3.5653777489711014)Point B(1.955181182907337, 3.5653777489711014)
AI Drawing Prompt Reference
Draw a graph with two fixed points located on the line y=3.57, one on the left of x=-11.2 and the other on the right of x=1.95, to illustrate the linear relationship between unit price, total cost, and quantity, suitable for teaching demonstrations or student exploration of linear functions and equations.
The prompt above was compiled from the original drawing commands and is for reference only.