
Practice - Graphing Systems of Equations
Loading the math board and drawing, please wait…
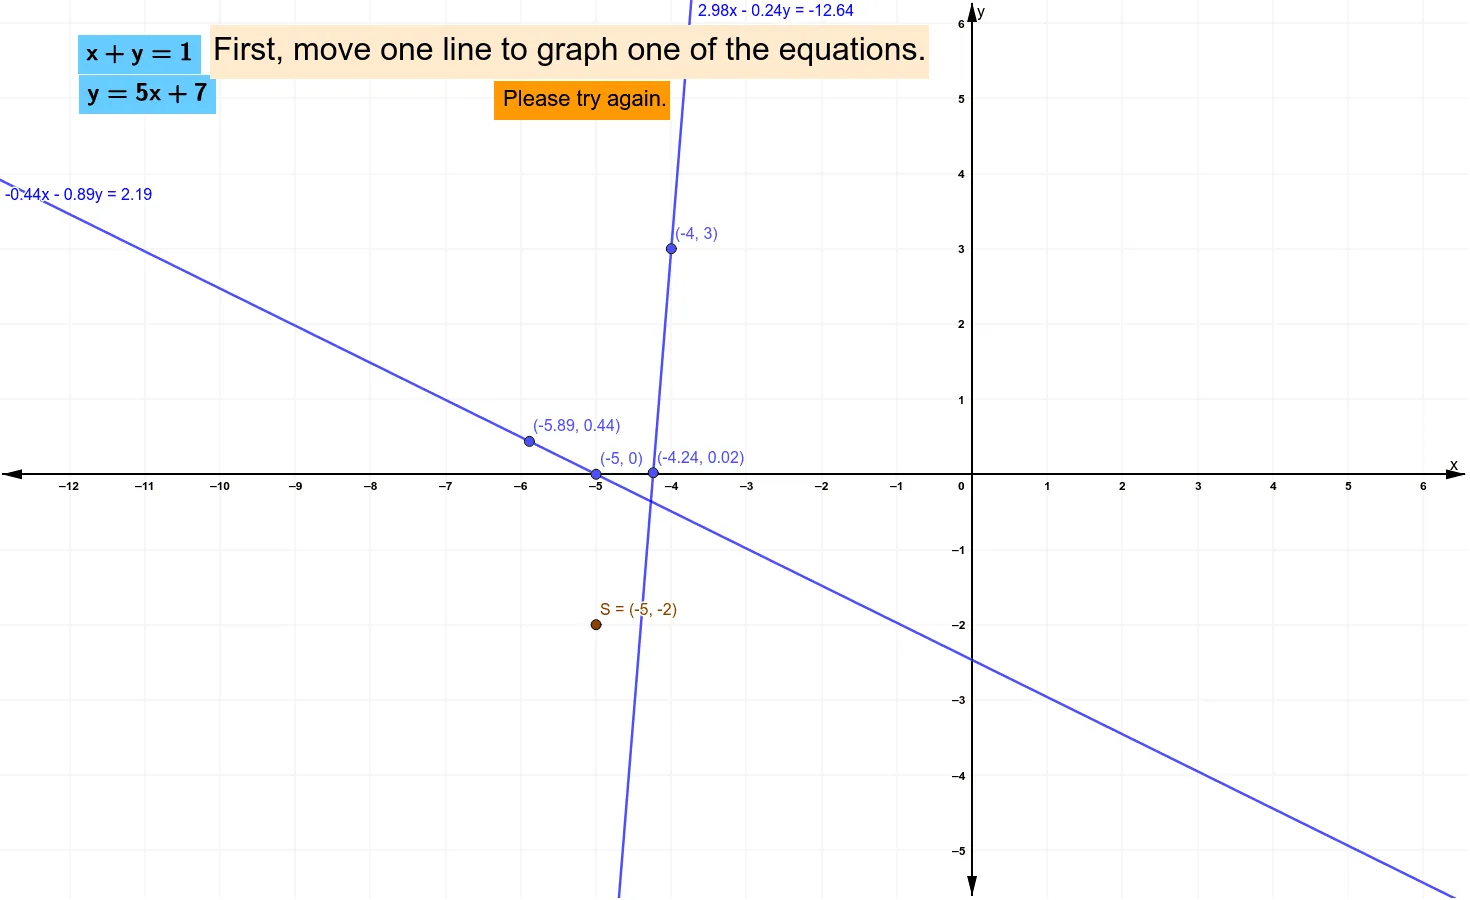
This example demonstrates how to solve systems of linear equations using graphical methods, visually showing the intersection point of two lines as the solution. Core math concepts include linear equations, function graphs, and coordinate geometry. Construction highlights the use of GeoGebra commands and objects such as Line, Point, and Intersect to draw function graphs and determine intersection points. Suitable for middle school and above students for learning and practicing graphical solutions to linear systems.
GeoGebra Commands & Parameters
Line(fA, fB) → fLine(gA, gB) → gPoint(yAxis) → iALine(iA, iB) → iPoint(yAxis) → hAPoint(xAxis) → hBLine(hA, hB) → hIntersect(i, h) → Solution