
Practice Graphing Linear Inequalities
Loading the math board and drawing, please wait…
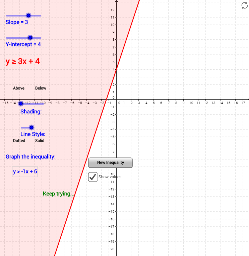
This example demonstrates how to graph linear inequalities. The key mathematical concept involved is linear inequalities. Using GeoGebra commands such as OrthogonalLine, Intersect, and Polygon, the graph of the inequality can be constructed. Suitable for middle school and above students to practice graphing linear inequalities.
GeoGebra Commands & Parameters
OrthogonalLine(A, xAxis) → cOrthogonalLine(B, xAxis) → dOrthogonalLine(A, yAxis) → eOrthogonalLine(B, yAxis) → gIntersect(c, g) → CIntersect(d, e) → DPolygon(A, D, B) → poly1, b_1, a_1, d_1Polygon(A, B, C) → poly2, c_1, a_2, b_2Polygon(A, A2, B2, B) → poly3, a_3, a2, b2_1, b_3Polygon(A3, B3, B, A) → poly4, a3, a4, b_4, a_4RandomElement({0, -1, 1, -2, 2, -3, 3, -4, 4, -0.5, 0.5}) → m2Random(-8, 8) → b2RandomElement({-1, 1}) → h2RandomElement({-1, 1}) → i2