
Practice: Adding and Subtracting Decimals
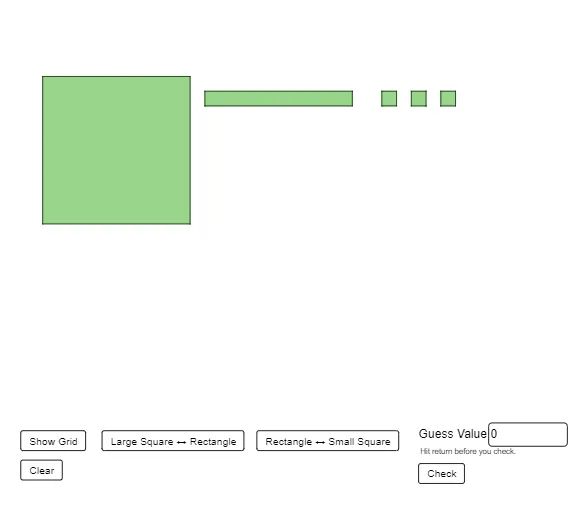
Loading the math board and drawing, please wait…
This example demonstrates the geometric representation of decimal addition and subtraction. Key mathematical concepts include decimal operations. Using GeoGebra commands such as Textfield and Sequence, users can visually understand the process of decimal addition and subtraction. Suitable for high-grade elementary or low-grade middle school students for math practice.
GeoGebra Commands & Parameters
Textfield(a) → GuessValueSequence(Segment[(2.3, 0.5 + (0.1 * i)), (3.3, 0.5 + (0.1 * i))], i, 0, 10) → list2_1Sequence(Segment[(2.3 + i, 0.5), (2.3 + i, 1.5)], i, 0, 1) → list1_1Sequence(Segment[(3.3 + (0.1 * i), 0.5), (3.3 + (0.1 * i), 0.6)], i, 0, 10) → list3_1Sequence(Segment[(3.3, 0.5 + (0.1 * i)), (4.3, 0.5 + (0.1 * i))], i, 0, 1) → list4_1LargeSquare(B) → f, g, h, i, q1Rectangle(C) → j, k, l, m, q2SmallSquare(D) → n, p, q, r, q3SmallSquare(E) → s, t, c, d, q4SmallSquare(F) → e, f_1, g_1, h_1, q5
AI Drawing Prompt Reference
Draw a geometric figure for practicing decimal addition and subtraction. Start with a large square, then a rectangle, and four small squares arranged in sequence. Beside the large square, create a grid of horizontal line segments representing decimal parts, extending upward from the bottom with eleven ticks. Add two vertical line segments to enclose the grid into a rectangular area. Above the grid, place an input box for entering values. The layout should clearly visualize decimal operations.
The prompt above was compiled from the original drawing commands and is for reference only.