
Power Functions
Loading the math board and drawing, please wait…
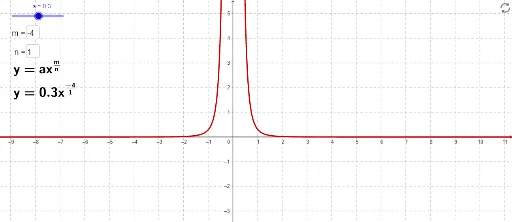
This example demonstrates the graph and properties of power functions, which are functions of the form y=x^n, where n is a constant. By adjusting the parameter n, you can observe the changes in the graph of the power function. The example uses GeoGebra commands such as Point, Tangent, Intersect, and Slope for construction. Suitable for high school mathematics education and learning about power functions.
GeoGebra Commands & Parameters
Point(f) → ATangent(A, f) → eIntersect(f, yAxis, 1) → DSlope(e) → kTextfield(m) → inputBox1Textfield(n) → inputBox2
AI Drawing Prompt Reference
Draw a graph of a power function of the form y = x^n, where n is a variable parameter. Place a point on the curve and construct the tangent line at that point. Also mark the intersection of the curve with the y-axis. Display the slope of the tangent line numerically. Provide two input fields to adjust the parameters m and n, allowing dynamic observation of how the curve and tangent slope change. Include coordinate axes and the function curve, suitable for high school teaching.
The prompt above was compiled from the original drawing commands and is for reference only.