
Power Functions with Positive Integer Exponents
Loading the math board and drawing, please wait…
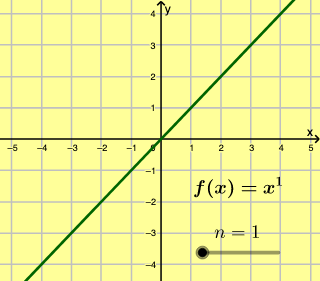
This GeoGebra example dynamically illustrates power functions with positive integer exponents, such as y = x^n where n is a positive integer. It demonstrates how the shape of the graph changes as the exponent varies, from straight lines (n=1) and parabolas (n=2) to cubic and higher-degree curves, highlighting key features like symmetry, monotonicity, and the common point (1,1). The core mathematical concepts include power functions, exponents, function graphing, parity (even/odd), and monotonic behavior. The construction uses a slider object 'n' to control the exponent, a function object 'f' to define the power function, and text objects 'text1' and 'text2' to display the current function expression and explanatory notes, enabling interactive parameter-driven exploration. This resource is suitable for middle and high school mathematics classrooms, ideal for teachers demonstrating function families or for students independently investigating how exponents affect graph shapes, building intuition for more advanced topics like exponential and logarithmic functions.
GeoGebra Commands & Parameters
Numeric n(1)f(x) = x^(n)
AI Drawing Prompt Reference
Draw a coordinate plane with a power function curve y = x^n, where n is a positive integer controlled by a slider. The slider allows n to vary from 1 upwardable. For n=1, the graph is a straight line through the origin; for n=2, it is an upward parabola; for n=3, it is a cubic curve symmetric about the origin; for even n, the curve is symmetric about the y-axis. All curves pass through the point (1,1). Display the current function expression and annotate key features such as symmetry and monotonicity. The layout should clearly show how the curve shape changes with the exponent.
The prompt above was compiled from the original drawing commands and is for reference only.