
Position Function and Derivative Connection
Loading the math board and drawing, please wait…
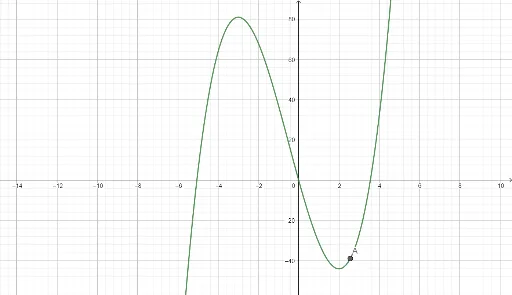
This example demonstrates the visual connection between a position function and its derivative (velocity function). It visually illustrates the geometric meaning of the derivative as the rate of change of the original function. Core mathematical concepts include derivatives, trigonometry, stochastic processes, standard deviation, integral calculus, and secant lines. Construction highlights the use of GeoGebra objects: f (function), a (parameter), A (point), g (function), B (point), h (function). Suitable for high school and above students to understand basic calculus concepts and function graph analysis.
GeoGebra Commands & Parameters
f(x) = (2 * x^(3)) + (3 * x^(2)) - (36 * x)Numeric a(2.563576702214929)(a, f(a))g(x) = f'(x)(a, g(a))y = f(a) + (g(a) * (x - a))
AI Drawing Prompt Reference
Draw a graph showing the connection between a position function and its derivative (velocity function). The graph should include a curve for the position function and a straight line for the derivative. The curve and line intersect at a specific point, where the line represents the slope of the curve at that point. The graph should clearly illustrate the geometric meaning of the derivative as the rate of change, helping to understand the concept.
The prompt above was compiled from the original drawing commands and is for reference only.