
Polynomial Inequalities by Antonio Di Muro
Loading the math board and drawing, please wait…
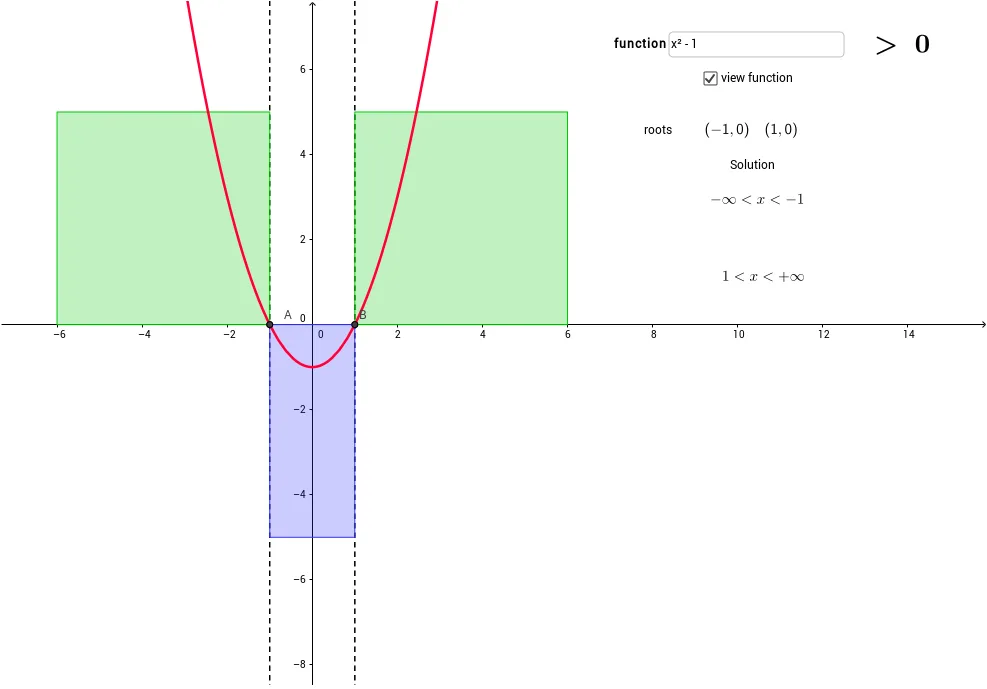
This example demonstrates the solution set of polynomial inequalities in a coordinate system. Key math concepts include inequality solving, function graphs, root distribution, and interval analysis. GeoGebra commands used in construction are Root (to find roots), RemoveUndefined (to remove undefined objects), Insert (to insert elements), Length (to measure length), Sequence (to create sequences), Textfield (for text input), Element (to access elements), Polygon (to create polygons), If (for conditional logic), and TableText (for tabular display). Suitable for high school and above students to understand the relationship between inequalities and function graphs, and to dynamically visualize the effect of parameter changes on solution sets.
GeoGebra Commands & Parameters
Root(f) → A, B, C, D, E, E_1RemoveUndefined(L_1) → soluzioniInsert(First[soluzioni] + (-5, 0), soluzioni, 1) → lista1Length(soluzioni) → A2Insert(Last[soluzioni] + (5, 0), lista1, A2 + 2) → estesaSequence(OrthogonalLine[Element[soluzioni, i], xAxis], i, 1, A2) → retteSequence((Element[estesa, i] + Element[estesa, i + 1]) / 2, i, 1, A2 + 1) → intermediSequence(Polygon[Element[estesa, i], Element[estesa, i + 1], Element[estesa, i + 1] + (0, 5), Element[estesa, i] + (0, 5)], i, 1, A2 + 1) → polisuSequence(Polygon[Element[estesa, i], Element[estesa, i + 1], Element[estesa, i + 1] + (0, -5), Element[estesa, i] + (0, -5)], i, 1, A2 + 1) → poligiuSequence(If[f(x(Element[intermedi, i])) > 0, Element[polisu, i], Element[poligiu, i]], i, 1, A2 + 1) → lista2Sequence(If[f(x(Element[intermedi, i])) > 0, Element[polisu, i]], i, 1, A2 + 1) → lista3Sequence(If[f(x(Element[intermedi, i])) < 0, Element[poligiu, i]], i, 1, A2 + 1) → lista4Textfield(f) → campoInserimento1Length(soluzioni) → bElement(soluzioni, 1) → FPolygon(G, H, I, J) → poli1, g, h, i, jPolygon(G_1, H_1, I_1, J_1) → poli1_1, g_1, h_1, i_1, j_1If(f(x(Element[soluzioni, 1] - 1)) < 0, Sequence[If[f((x(Element[soluzioni, i]) + x(Element[soluzioni, i + 1])) / 2) > 0, ((x(Element[soluzioni, i]) * " < x < ") * x(Element[soluzioni, i + 1]))], i, 1, b - 1], 0) → lista5TableText({soluzioni}) → testo4TableText({lista5}) → testo5If(f(x(Element[soluzioni, 1] - 1)) > 0, Sequence[If[f((x(Element[soluzioni, i + 1]) + x(Element[soluzioni, i + 2])) / 2) > 0, ((x(Element[soluzioni, i + 1]) * " < x < ") * x(Element[soluzioni, i + 2]))], i, 1, b - 1], 0) → lista6TableText({lista6}) → testo3
AI Drawing Prompt Reference
Draw a coordinate system with a polynomial function graph, marking all its x-intercepts. Fill the regions above and below the x-axis with colored or semi-transparent rectangles based on the function's sign in each interval, visually representing the solution set of the inequality. Include an editable text field near the graph to modify the function expression. Also display a table listing all intercept coordinates, and show the solution intervals (e.g., "a < x < b") in text form below or beside the graph. The layout should clearly present the function curve, solution intervals, and corresponding tables.
The prompt above was compiled from the original drawing commands and is for reference only.