
Polynomial Functions and Intersections
Loading the math board and drawing, please wait…
In collections
Grade 12 Calculus & Vectors MCV4U1
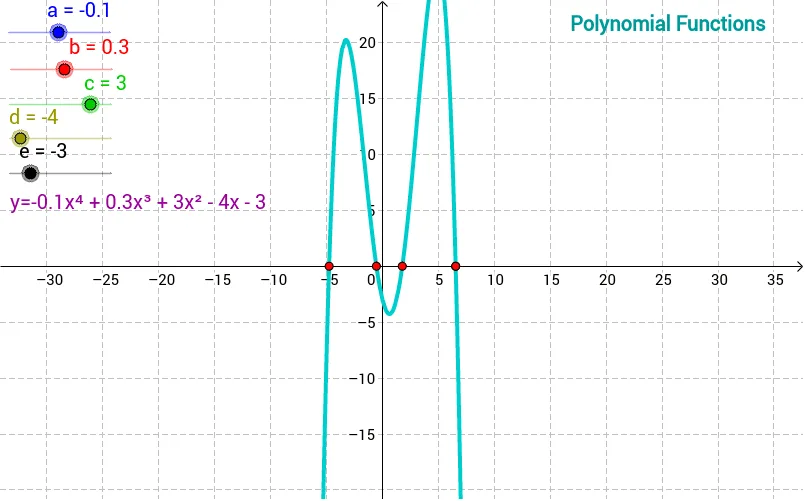
This example demonstrates polynomial function graphs and their intersection relationships, using dynamic GeoGebra visuals to show how curves and key points are positioned. Core concepts include polynomial functions, real-number parameters, graphing, intersections, and coordinate geometry. Construction highlights: the Intersect command is used to create intersection points between function graphs or curves; objects a, b, c, d, e, and f represent parameters or expressions; text1 and text2 provide explanatory labels; and points A, B, C, D, and E mark intersections or key locations. It is suitable for middle-school to high-school mathematics, function-graph exploration, introductory coordinate geometry, and visual modeling.
GeoGebra Commands & Parameters
Intersect(f, xAxis, 4) → AIntersect(f, xAxis) → B, C, D, E
AI Drawing Prompt Reference
Draw the graphs of two polynomial functions, showing their intersections with the x-axis, with one intersection at x=4 and several others on the x-axis. Label the positions and relationships of these intersections with text, and mark key points and intersection points with dots to illustrate the characteristics of polynomial function graphs and their intersections with the x-axis.
The prompt above was compiled from the original drawing commands and is for reference only.