
Polynomial Function with Sliders: Parameters a, k, h Shape and Shift the Graph
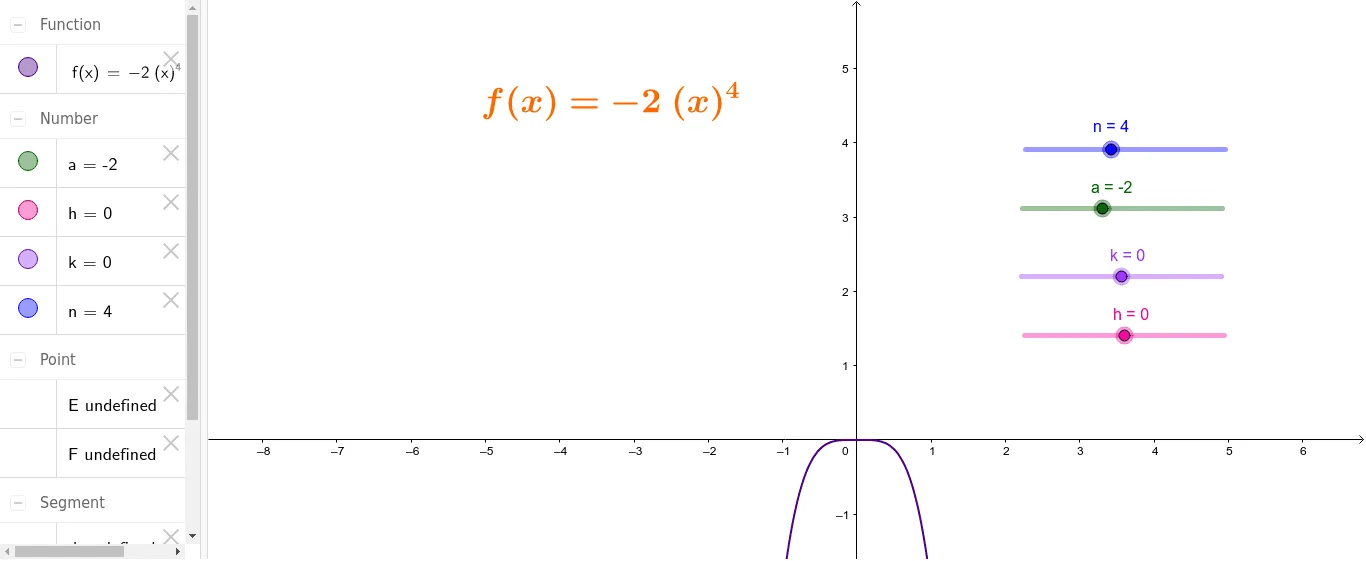
This GeoGebra example demonstrates how changing parameters in a polynomial function affects the displayed curve: the parameter a determines the opening/scale (shape stretch), while k and h control the vertical and horizontal shifts, respectively. As a result, students can directly observe the geometric meaning of function parameters. The key math concepts include polynomial function graph behavior, parameter-driven transformations, and function translation (vertical and horizontal shifts), as well as how coefficients influence the curve’s form such as opening size and scaling. Construction-wise, the example builds a visual framework using line segments and related objects: the construction summary shows the use of the Segment command to create segment objects, together with objects n, E, F, d, a, k, h, f, and text1 to define points/parameters/function output and to annotate the dynamic graph. Suitable for middle and high school students learning function transformations and for classroom activities focused on interactive graph interpretation.
Loading the math board and drawing, please wait…