
Polygon Visualization Based on Functions
Loading the math board and drawing, please wait…
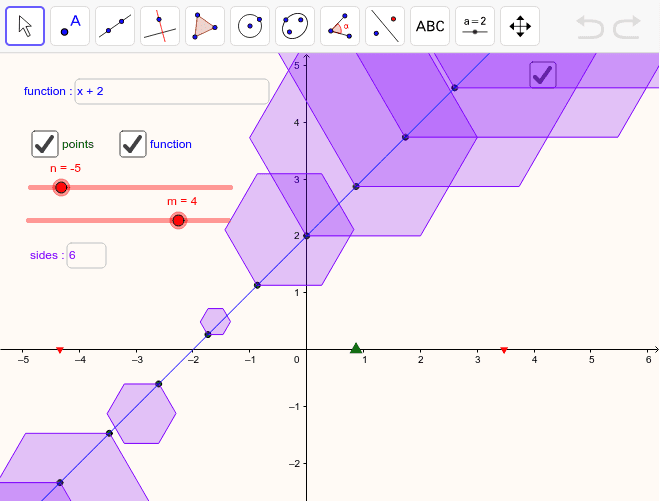
This example visualizes functions by plotting regular polygons whose scale is determined by the function. Key mathematical concepts include functions, polygons, and linear equations. It uses commands like Point, Sequence, and Textfield, suitable for high school mathematics education.
GeoGebra Commands & Parameters
Point(y = 0) → ASequence(((i * x(A)), f((i * x(A)))), i, n, m) → list1Textfield(f) → inputBox1Sequence(Polygon[Element[list1, i], Element[list1, i] + (y(Element[list1, i]), 0), s], i, 1, m - n + 1) → list2Textfield(s) → inputBox2
AI Drawing Prompt Reference
Create a polygon visualization based on a function. Start by plotting a point A on the y-axis, then generate a sequence of points based on the input function f(x), which will be used to construct the polygons. Next, input the number of sides s for the polygons, and use these points and the number s to draw a series of polygons, with the side length determined by the function f(x).
The prompt above was compiled from the original drawing commands and is for reference only.