
Polar Graphs: Exploring Mathematical Beauty
Loading the math board and drawing, please wait…
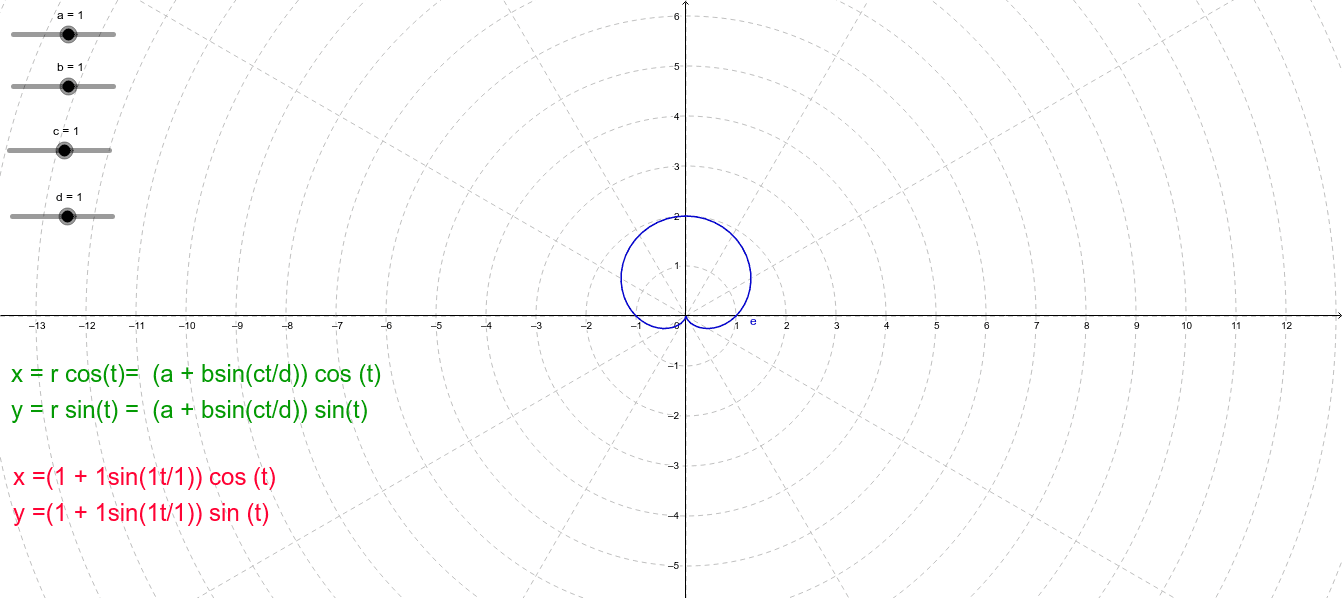
Polar Graphs demonstrates the concept of plotting curves in polar coordinates. Key mathematical concepts include polar coordinates, parametric equations, and graphing functions. Construction involves using the CurveCartesian command and objects a, b, c, d, e, text2, text1. Suitable for high school students to learn about geometry and function graphing, useful for math teaching and self-exploration.
GeoGebra Commands & Parameters
CurveCartesian(((a + (b * sin((c * t / d)))) * cos(t)), ((a + (b * sin((c * t / d)))) * sin(t)), t, -12.566370614359172, 12.566370614359172) → e
AI Drawing Prompt Reference
Plot a polar graph using the parametric equations (a + b * sin(c * t / d)) * cos(t) and (a + b * sin(c * t / d)) * sin(t) for t ranging from -12.566 to 12.566, showcasing the beauty of the curve.
The prompt above was compiled from the original drawing commands and is for reference only.