
Polar Grapher with Velocity and Acceleration Vectors
Loading the math board and drawing, please wait…
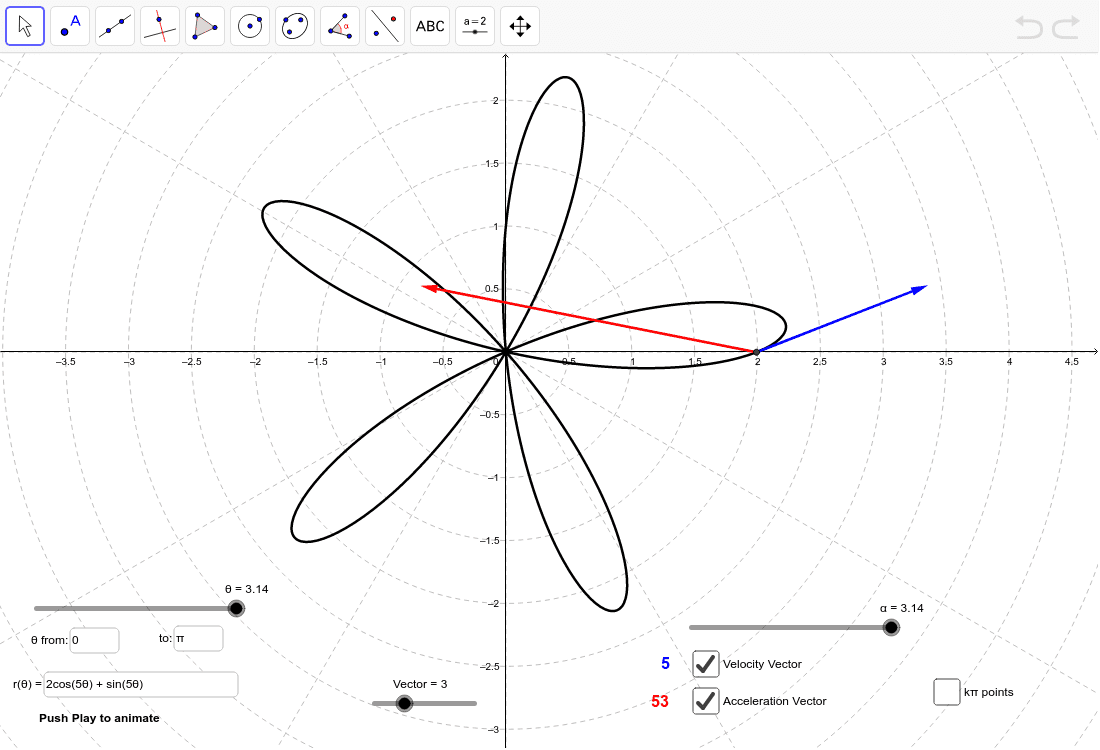
This is a fun little applet for graphing polar curves in GeoGebra. You can input any r function and set the bounds near the slider. By adjusting parameters, you can observe changes in velocity and acceleration vectors. The example involves polar curves, vectors, and functions. It uses commands like CurveCartesian, Vector, Sequence, Textfield, Translate, and Length. Suitable for high school and above students learning calculus and vector concepts.
GeoGebra Commands & Parameters
Max(MagA, a, j) → CCurveCartesian((r(t) * cos(t)), (r(t) * sin(t)), t, a, θ) → PolarVector(P, A) → uVector(P, V) → vSequence(((r(k) * cos(k)), (r(k) * sin(k))), k, 0, θ) → list1Textfield(r) → inputBox1Textfield(a) → inputBox2Textfield(j) → inputBox3Max(MagV, a, j) → BTranslate(ScaledA, P) → ScaledA'Vector(P, ScaledA') → wTranslate(ScaledV, P) → ScaledV'Vector(P, ScaledV') → bLength(VelocV) → eLength(AccV) → h
AI Drawing Prompt Reference
Draw a polar curve and display velocity and acceleration vectors on it. First, input the radial function r(t) and set the angle range from a to θ. Then, generate the polar curve Polar based on r(t). Next, select a point P on the curve and calculate the velocity vector u and acceleration vector v. By adjusting parameters a and j, observe the changes in the vectors. Finally, show the lengths of the velocity and acceleration vectors.
The prompt above was compiled from the original drawing commands and is for reference only.