
Poisson Distribution Probability Graph
Loading the math board and drawing, please wait…
In collections
Project3Formative Parabola Assessment
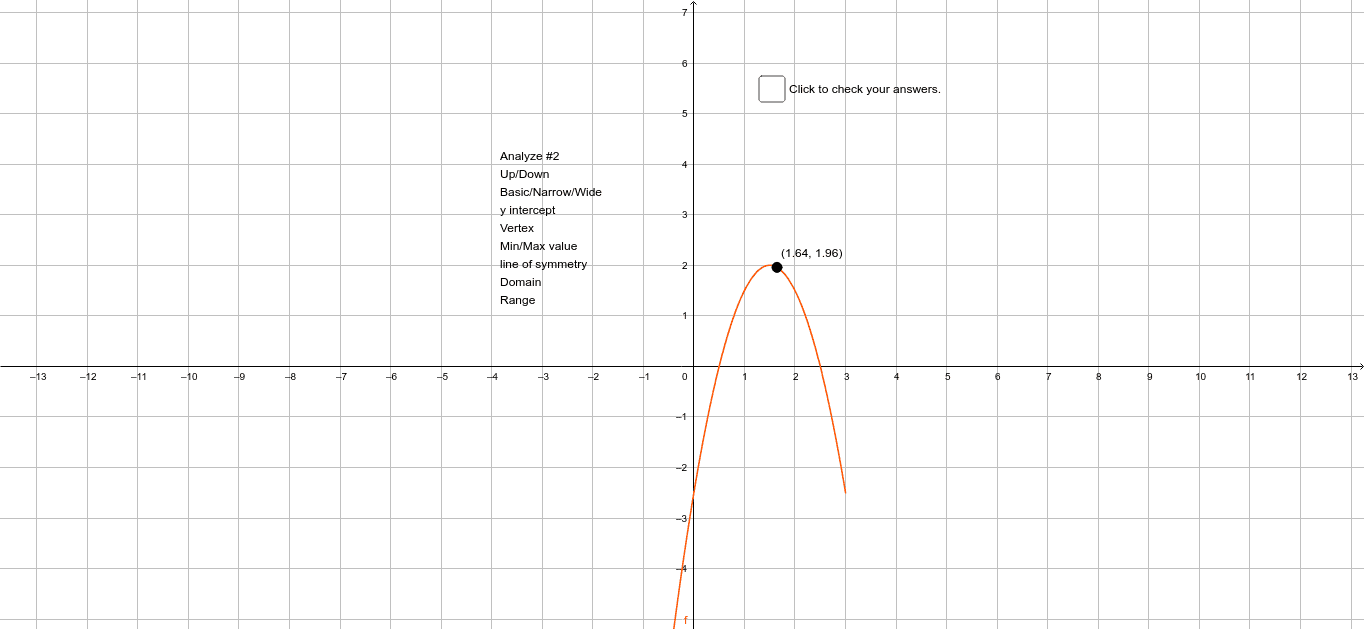
This example demonstrates the probability graph of the Poisson distribution, showing different probability distributions by adjusting parameters. Key mathematical concepts include the probability calculation of the Poisson distribution and the drawing of the distribution graph. It uses GeoGebra commands such as Point, text1, f, text2, a, and A for construction. Suitable for high school mathematics teaching and learning probability statistics.
GeoGebra Commands & Parameters
Point(f) → A
AI Drawing Prompt Reference
Draw the probability graph of the Poisson distribution and show different distributions by adjusting parameters. First define the Poisson distribution function f, then take a point A on the function to represent the probability value for a specific parameter.
The prompt above was compiled from the original drawing commands and is for reference only.