
Poisson Distribution by Hannu Mäkiö
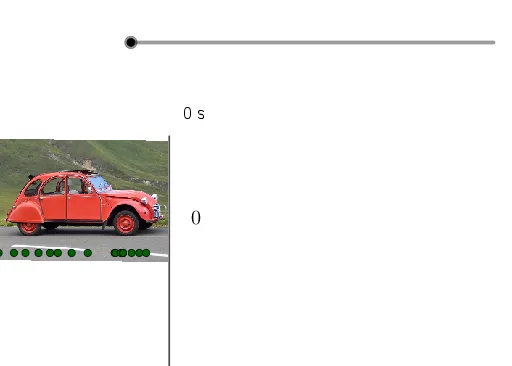
Loading the math board and drawing, please wait…
In collections
Probability distributions with GeoGebra
This example demonstrates the probability distribution of the Poisson distribution. It involves core concepts of probability and statistics, and uses GeoGebra commands such as Sequence and FrequencyTable to illustrate the construction of the Poisson distribution. Suitable for high school and above students or teachers to understand the basic principles of probability distribution and statistics.
GeoGebra Commands & Parameters
Sequence(RandomPoisson[la], i, 1, n) → satListaFrequencyTable(satLista) → teksti1Sort(Flatten[Sequence[Sequence[(-k) + Random[0, 100] / 101, i, 1, Element[satLista, k]], k, 1, n]]) → xarv1CountIf(x ≥ 0, xarv2) → menneetSum(satLista, floor(t)) → kertyneetPoint(yAxis) → BSegment(A, B) → fPoint(f) → CCircle(C, t - floor(t)) → cOrthogonalLine(C, f) → gIntersect(c, g, 2) → DSegment(C, D) → hTake(satLista, 1, floor(t)) → satLisMeniFrequencyTable(satLisMeni) → teksti4Polygon(E, F, G, H) → m1, e, f_1, g_1, h_1