
Point Functions on a Line Exercise
Loading the math board and drawing, please wait…
This example demonstrates how to plot point functions on a line and observe their variation patterns. It involves core mathematical concepts such as functions, coordinate geometry, derivatives, and differential calculus. Construction highlights include the use of GeoGebra commands and objects like Random, Textfield, Point, Polygon, LaTeX, and TableText. Suitable for high school mathematics teaching, helping students understand the geometric meaning of function graphs and derivatives.
GeoGebra Commands & Parameters
Random(1, 5) → deltaxTextfield(g) → InputBox1Point(f) → APolygon(B, C, D, E) → poly1, b_1, c_1, d_1, e_1LaTeX(a, true, true) → text10LaTeX(b, true, true) → text11TableText({{A_1, C_1}, {A3, B3}, {A4, B4}, {A5, B5}, {A6, B6}, {A7, B7}, {A8, B8}, {A9, B9}}, "|_r") → text2Textfield(a_1) → InputBox2LaTeX(h, true, true) → text12
AI Drawing Prompt Reference
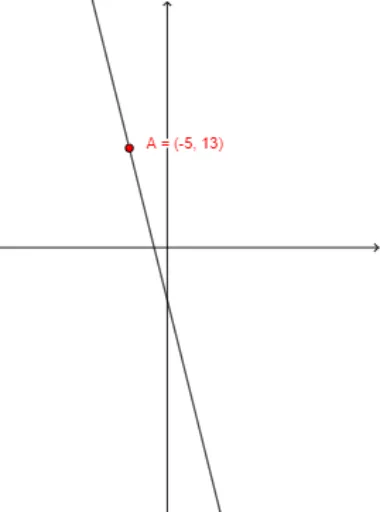
Draw a line and randomly select a point A on it. Then, based on the position of point A, draw a polygon poly1 with four vertices. Next, select another point B on the line and plot the graph of function f at point B. Observe the changes in the function graph by adjusting the position of point A. Finally, display the function expression and coordinates of some key points in LaTeX format in the coordinate system.
The prompt above was compiled from the original drawing commands and is for reference only.