
Piecewise Linear Functions: Grade 8 Math Lesson
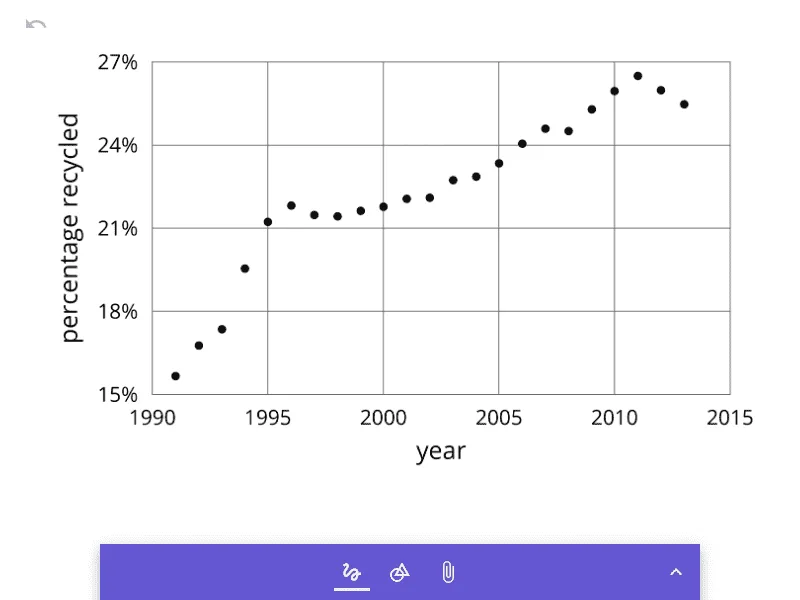
Loading the math board and drawing, please wait…
This GeoGebra example demonstrates piecewise linear functions, showing how different linear expressions apply over distinct intervals to model real-world situations. The core mathematical concepts include functions, linear functions, piecewise definitions, slope and intercept, and continuity of graphs. Construction notes: the summary only mentions object 'pic1', likely an embedded image or preset figure; in practice, teachers can use GeoGebra's input bar to define piecewise functions (e.g., using the If command) and plot them, with sliders to adjust parameters and observe changes. This resource is suitable for Grade 8 (middle school) mathematics classrooms, introducing the concept of piecewise functions, understanding how function expressions differ across intervals, and solving applied problems such as billing or travel scenarios.
AI Drawing Prompt Reference
Draw a graph of a piecewise linear function with the x-axis as the independent variable and the y-axis as the function value. The graph consists of three straight line segments with different slopes, each covering a distinct interval on the x-axis, with endpoints either connected or separated to show the piecewise definition. Include coordinate axes, grid lines, and a slider that adjusts the slope or intercept of one segment, allowing observation of how the graph changes. The style is clean and suitable for middle school math, emphasizing how the function expression differs across intervals.
The prompt above was compiled from the original drawing commands and is for reference only.