
Piecewise Functions
Loading the math board and drawing, please wait…
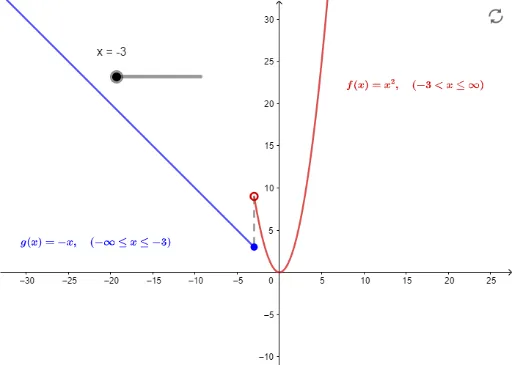
This example demonstrates the graph of a piecewise function, which is defined by different functions in different intervals. Using GeoGebra commands like Segment, users can draw the graph of a piecewise function. This example is suitable for high school mathematics education, helping students understand the concept and graphical characteristics of piecewise functions.
GeoGebra Commands & Parameters
Segment(A, B) → h
AI Drawing Prompt Reference
Draw the graph of a piecewise function defined by different functions over different intervals, using line segments to represent each part of the function to illustrate its characteristics.
The prompt above was compiled from the original drawing commands and is for reference only.