
Piecewise Function Graphing by agilitygordons
Loading the math board and drawing, please wait…
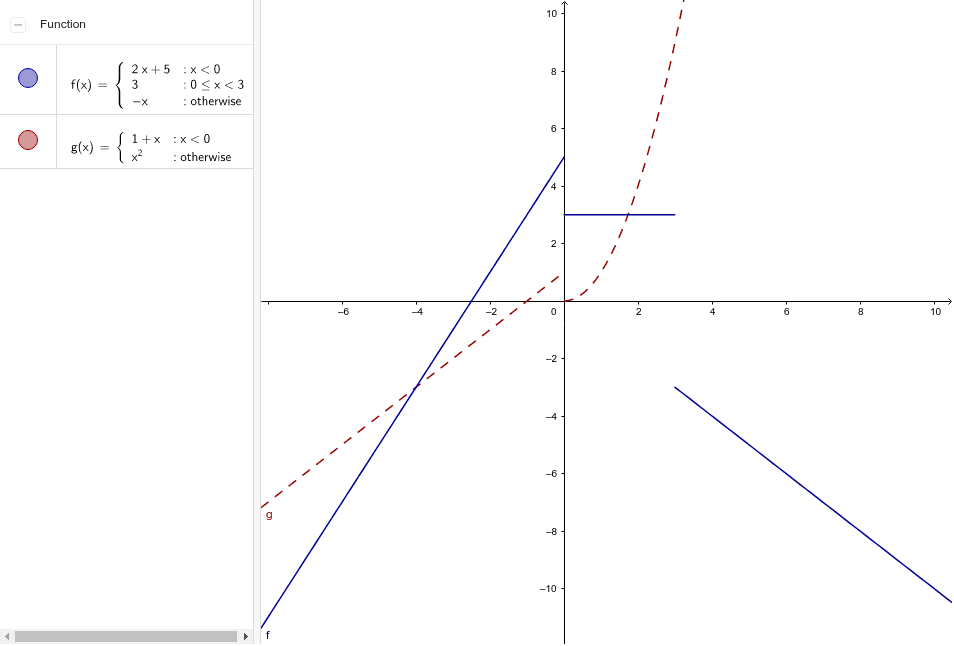
This example demonstrates how to graph piecewise functions using GeoGebra, showcasing their geometric properties. Key math concepts include functions, piecewise functions, function graphs, circumcircle, quadratic equations, rhombus, and kite. Construction highlights involve the GeoGebra 'If' command and objects 'g, f'. Suitable for high school mathematics teaching to understand the properties and methods of drawing piecewise functions.
GeoGebra Commands & Parameters
If(x < 0, 1 + x, x^(2)) → gIf(x < 0, 2 * x + 5, If[x < 3, 3, -x]) → f
AI Drawing Prompt Reference
Draw a piecewise function graph with two line segments and a parabolic part. For x less than 0, y is 1+x; for x between 0 and 3, y is x squared; for x greater than or equal to 3, y is 2x+5. Start by drawing the line segment for x less than 0, then draw the parabolic part for x between 0 and 3, and finally draw the line segment for x greater than or equal to 3.
The prompt above was compiled from the original drawing commands and is for reference only.