
Pie Chart Interpretation
Loading the math board and drawing, please wait…
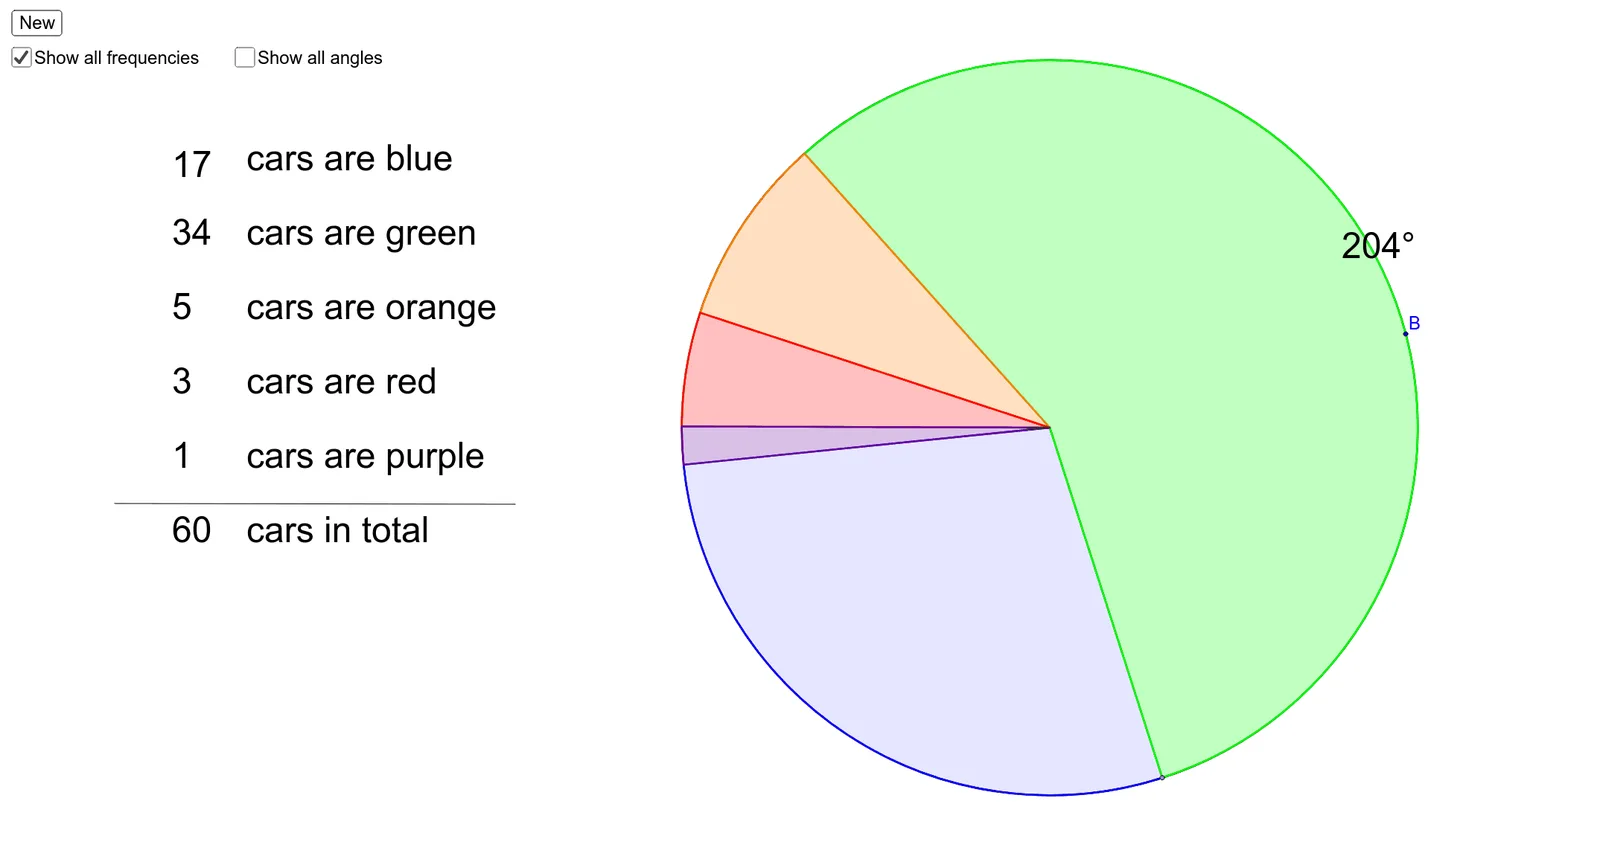
This example demonstrates how to create and interpret pie charts using GeoGebra, involving core math concepts like percentage calculations, data visualization, and geometric shapes (circles, sectors). Key GeoGebra commands and objects used include Random, Remove, Element, Circle, Point, Rotate, Angle, CircleSector, Segment, RandomElement. Suitable for middle school and above students learning data statistics and geometric constructions.
GeoGebra Commands & Parameters
Random(1, 5) → displayRandom(1, 5) → display2Remove({1, 2, 3, 4, 5}, {display2, display}) → listElement(a, Random[1, 20]) → totalRandom(1, total - 4) → blueRandom(1, total - blue - 3) → greenRandom(1, total - blue - green - 2) → orangeCircle(A, B) → cPoint(c) → DRotate(D, (-(((blue * multiplier))°)), A) → D'Angle(D', A, D) → αCircleSector(A, D', D) → dRotate(D, ((green * multiplier))°, A) → D'_1Angle(D, A, D'_1) → βCircleSector(A, D, D'_1) → eRandom(1, total - blue - green - orange - 1) → redRandom(total - blue - green - orange - red, total - blue - green - orange - red) → purpleRotate(D'_1, ((orange * multiplier))°, A) → GAngle(D'_1, A, G) → γCircleSector(A, D'_1, G) → fRotate(G, ((red * multiplier))°, A) → G'Angle(G, A, G') → δCircleSector(A, G, G') → gRotate(G', ((purple * multiplier))°, A) → G''Angle(G', A, G'') → εCircleSector(A, G', D') → hSegment(O, P) → kRotate(D', α / 2, A) → D''Angle(D', A, D'') → ζRotate(D, β / 2, A) → D'_2Angle(D, A, D'_2) → ηRotate(D'_1, γ / 2, A) → HAngle(D'_1, A, H) → θRotate(G, δ / 2, A) → G'_1Angle(G, A, G'_1) → ιRotate(G', ε / 2, A) → G''_1Angle(G', A, G''_1) → κRandomElement(list) → missing
AI Drawing Prompt Reference
Create a pie chart with multiple sectors of different colors, each representing different data proportions. Start by drawing a circle, then divide it into several sectors based on randomly generated values, with each sector having a unique color and size. Finally, mark the remaining part as missing data.
The prompt above was compiled from the original drawing commands and is for reference only.