
Phantom Graph of Ellipse is Hyperbola (and vice versa)
Loading the math board and drawing, please wait…
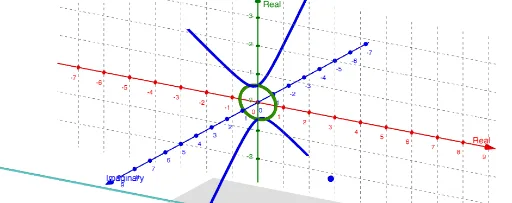
This example demonstrates the relationship between the phantom graphs of ellipses and hyperbolas, showing that the phantom graph of an ellipse forms a hyperbola and vice versa. Key mathematical concepts include ellipses, hyperbolas, phantom graphs, and analytic geometry. It utilizes GeoGebra commands like ComplexRoot (complex roots), Plane (plane), and CurveCartesian (cartesian curve). Suitable for high school students and math enthusiasts studying properties of conic sections and applications of complex numbers.
GeoGebra Commands & Parameters
ComplexRoot(1 - x^(2) / A^(2) - c^(2) / B^(2)) → z_1, z_2Plane((1, c, 1), (0, c, 0), (3, c, 2)) → eCurveCartesian(0, t, (A / B * sqrt(t^(2) - B^(2))), t, -25, 25) → hCurveCartesian(0, t, (((-A)) / B * sqrt(t^(2) - B^(2))), t, -25, 25) → iCurveCartesian(0, (B * cosh(t)), (A * sinh(t)), t, -25, 25) → jCurveCartesian(0, ((-B) * cosh(t)), (A * sinh(t)), t, -25, 25) → k
AI Drawing Prompt Reference
Draw a graph illustrating the relationship between the phantom graphs of ellipses and hyperbolas, showing how the phantom graph of an ellipse forms a hyperbola and vice versa. The graph should include two symmetric curves representing the phantom graphs of ellipses and hyperbolas, demonstrating their transformation relationship in the coordinate system. Start by plotting the ellipses and hyperbolas centered at the origin, then derive their phantom graphs through complex mathematical transformations, and finally plot the results on the same coordinate system to visually show their correspondence.
The prompt above was compiled from the original drawing commands and is for reference only.