
Percentages-3: Compound Change – Visualizing Successive Percentage Effects
Loading the math board and drawing, please wait…
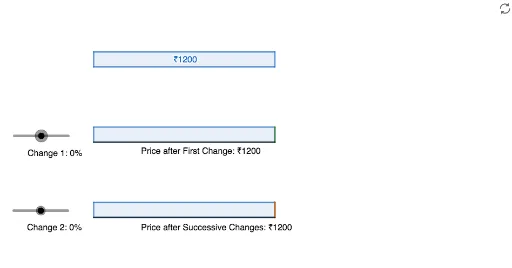
① This GeoGebra example demonstrates the concept of compound percentage change, showing how two successive percentage increases or decreases affect an initial quantity. ② Core mathematical concepts include percentages, compound growth/decay, proportional reasoning, and the cumulative effect of sequential changes, with connections to integers and expected value. ③ Construction details: Based on the summary, the example uses GeoGebra commands such as Point, Polygon, and Segment, creating multiple points (A, B, C, D, etc.) and polygon objects, with parameters Percentage1 and Percentage2 controlling the percentage changes. The dynamic visualization allows users to adjust these percentages and observe the resulting geometric representation of the final value. ④ This resource is suitable for middle or high school students learning about percentage applications, compound interest, or growth models, and can also serve as an introductory tool for economics or statistics courses to illustrate nonlinear effects of repeated percentage changes.
GeoGebra Commands & Parameters
Point(xAxis) → APolygon(A, X, Y, B) → q1, a_1, x_1, y_1, b_1Polygon(C, W, V, D) → q2, c, w, v, dPolygon(X, E, F, Y) → q3, x_2, e, f, y_2Polygon(W, P, Q, V) → q4, w_1, p, q, v_1Polygon(P, G, H, Q) → q5, p_1, g, h, q_1Polygon(I, K, L, J) → q6, i, k, l, jSegment(A, E) → mSegment(D, H) → n
AI Drawing Prompt Reference
Create a dynamic visualization showing how an initial quantity is affected by two successive percentage changes. The graphic includes multiple polygons and segments, with sliders controlling the magnitude of the percentage changes. Start by drawing a polygon representing the initial quantity, then adjust its size and shape based on the two percentage changes, connecting key points with segments to geometrically represent the final value.
The prompt above was compiled from the original drawing commands and is for reference only.