
Percentage of an Amount (10%) – Interactive Visual
Loading the math board and drawing, please wait…
In collections
Concrete-Pictorial-Abstract and the Teaching for Mastery
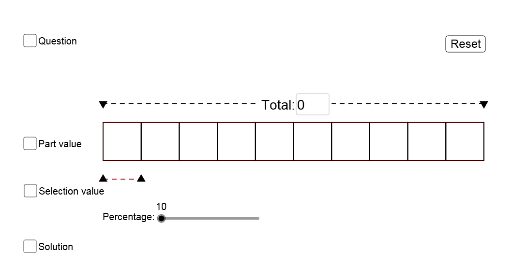
① This GeoGebra example dynamically demonstrates how to calculate 10% of a given amount, turning the abstract concept of percentage into a tangible visual operation. ② The core mathematical concept is percentage, involving proportional reasoning, fraction-decimal equivalence, and basic arithmetic. ③ Construction highlights: uses Polygon to build base shapes, Segment to partition regions, Textfield for user input, Midpoint for positioning, and Random to generate varied data; objects include multiple points (A, B, C, D, etc.), polygon poly1, segments (q, r, s, t, etc.), and functions (f, g, h, etc.), creating an interactive interface that visualizes the 10% calculation. ④ Suitable for upper primary to lower secondary students, ideal for introductory lessons on percentages, and useful as a classroom demonstration tool to help learners grasp the practical meaning of 'finding a percentage of a quantity'.
GeoGebra Commands & Parameters
Polygon(B, A, A10, B10) → poly1, q, r, s, tSegment(B1, A1) → fSegment(B2, A2) → gSegment(B3, A3) → hSegment(B4, A4) → iSegment(B5, A5) → jSegment(B6, A6) → kSegment(B7, A7) → lSegment(B8, A8) → mSegment(B9, A9) → nSegment(B10, A10) → pTextfield(D1) → InputBox1Segment(E, F) → s_2Segment(E_1, F_1) → s_3Segment(I, K) → a_2Segment(A1, B1) → C1Segment(A2, B2) → C2Segment(A3, B3) → C3Segment(A4, B4) → C4Segment(A5, B5) → C5Segment(A6, B6) → C6Segment(A7, B7) → C7Segment(A8, B8) → C8Segment(A9, B9) → C9Segment(A10, B10) → C10Midpoint(K, I) → GRandom(1, 9) → E1Random(10, 99) → E3
AI Drawing Prompt Reference
Create an interactive visual for calculating 10% of an amount. Draw a large rectangle representing the whole, divided into 10 equal vertical strips, each shaded differently. Place an input box above or beside the rectangle for entering a number. Use a horizontal segment to split the rectangle into two parts, with percentage labels on top and corresponding values below. Add multiple small segments inside to further partition each strip, marking midpoints. Randomly generate a digit between 1 and 9 and a two-digit number between 10 and 99 for dynamic examples. Keep the layout clear to emphasize the 10% portion visually, suitable for classroom demonstration.
The prompt above was compiled from the original drawing commands and is for reference only.