
Peak Wavelength Radiation Function Demo
Loading the math board and drawing, please wait…
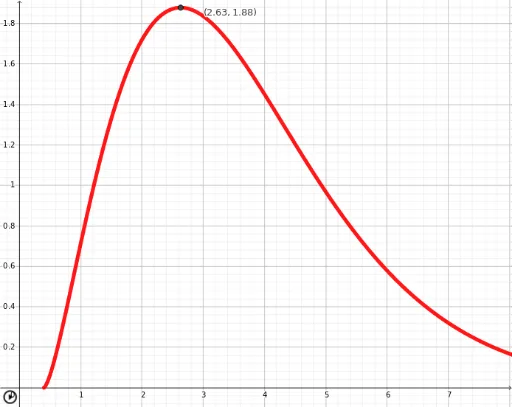
This example demonstrates the graph and properties of the peak wavelength radiation function. It involves core math concepts like functions, derivatives, and coordinate geometry. Construction highlights include using LaTeX, text fields, derivatives, NSolutions, and elements in GeoGebra. Suitable for high school students and math enthusiasts learning about function graphs and properties.
GeoGebra Commands & Parameters
LaTeX(f, true, true) → texto3Textfield(A) → CasillaDeEntrada1Textfield(B) → CasillaDeEntrada2Textfield(C) → CasillaDeEntrada3Derivative(f) → f'NSolutions(f') → l1Element(l1, 1) → x_s
AI Drawing Prompt Reference
Draw a function and its derivative, labeling the function expression in LaTeX and the zeros of the derivative, with text boxes for input parameters on the axes, first plot the function and derivative, then find and connect the zeros of the derivative, finally label the zero points.
The prompt above was compiled from the original drawing commands and is for reference only.