
Parabola with Table of Values
Loading the math board and drawing, please wait…
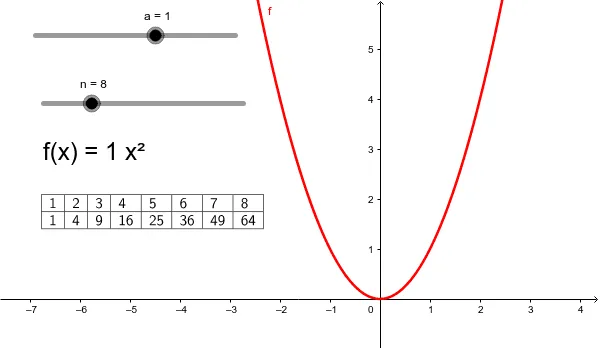
This example demonstrates a parabola and its table of values. It covers the basic properties of a parabola and the concept of functions. Using the GeoGebra command TableText, a table of values representing points on the parabola is created. Suitable for high school mathematics education, it aids in understanding the properties of parabolas and the methods of graphing functions.
GeoGebra Commands & Parameters
TableText({Sequence[i, i, 1, n], Sequence[f(i), i, 1, n]}, "|_") → text1
AI Drawing Prompt Reference
Draw a parabola and below it create a table showing the coordinates of points from x=1 to x=n and their corresponding y-values. The equation of the parabola is y=f(x), where f(x) is a quadratic function.
The prompt above was compiled from the original drawing commands and is for reference only.