
Parabola Graphing
Loading the math board and drawing, please wait…
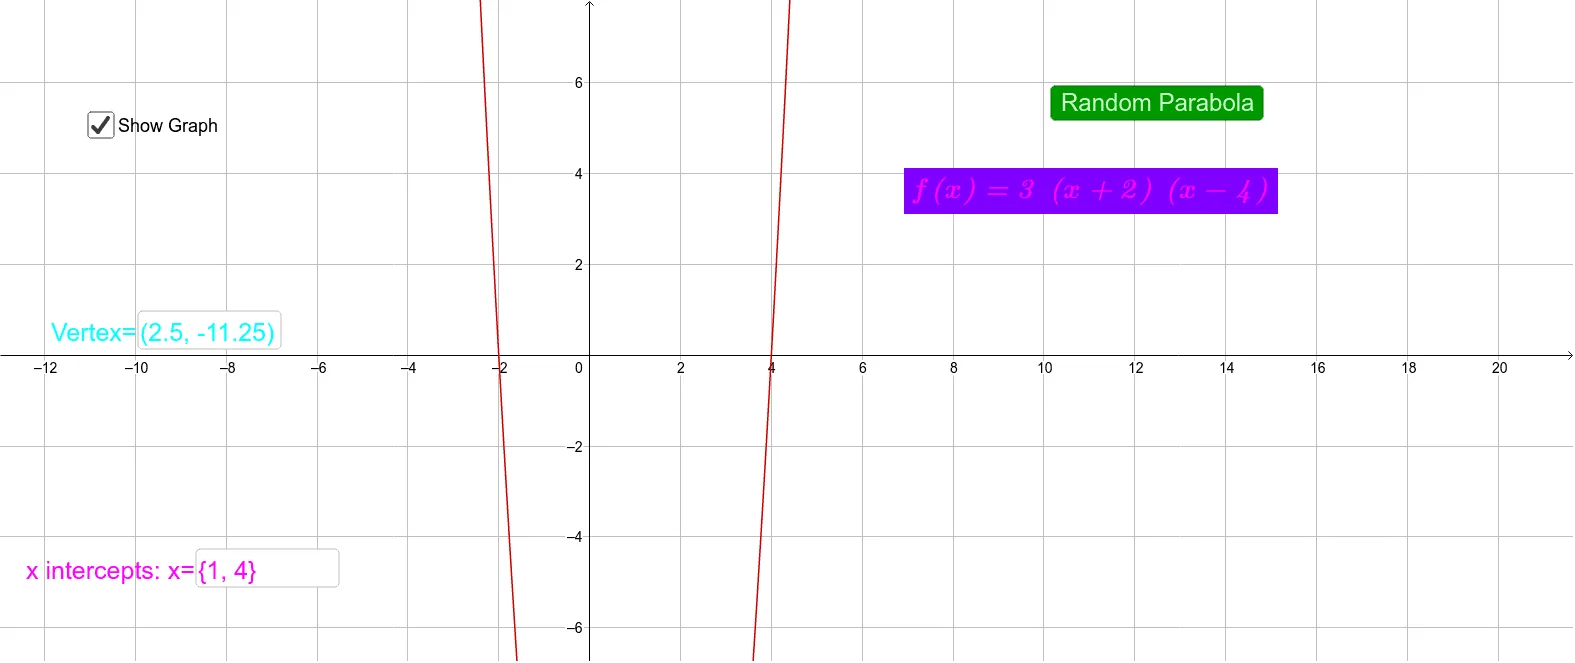
This example demonstrates the graphing of parabolas and their geometric transformations. Key math concepts include function graphs, coordinate geometry, and geometric transformations. Construction highlights involve using GeoGebra commands like Random, RandomElement, Expand, and Textfield to create dynamic parabolas with interactive parameters via buttons and input boxes. Suitable for high school mathematics education to understand the relationship between function graphs and parameter changes.
GeoGebra Commands & Parameters
Random(-5, 5) → bRandom(-5, 5) → cRandomElement({-5, -4, -3, -2, -1, 1, 2, 3, 4, 5}) → aExpand(((a * (x - b)) * (x - c))) → fTextfield(A) → InputBox1Textfield(list1) → InputBox2
AI Drawing Prompt Reference
Create a dynamic parabola graph demonstrating function graphs and geometric transformations. Include three randomly generated parameters that can be adjusted interactively via buttons and input boxes, showing how parameter changes affect the parabola's shape. Label the parameter values and use distinct colors for different parabolas to highlight the relationship between function graphs and parameter variations, suitable for high school mathematics education.
The prompt above was compiled from the original drawing commands and is for reference only.