
Parabola and Function Graphs
Loading the math board and drawing, please wait…
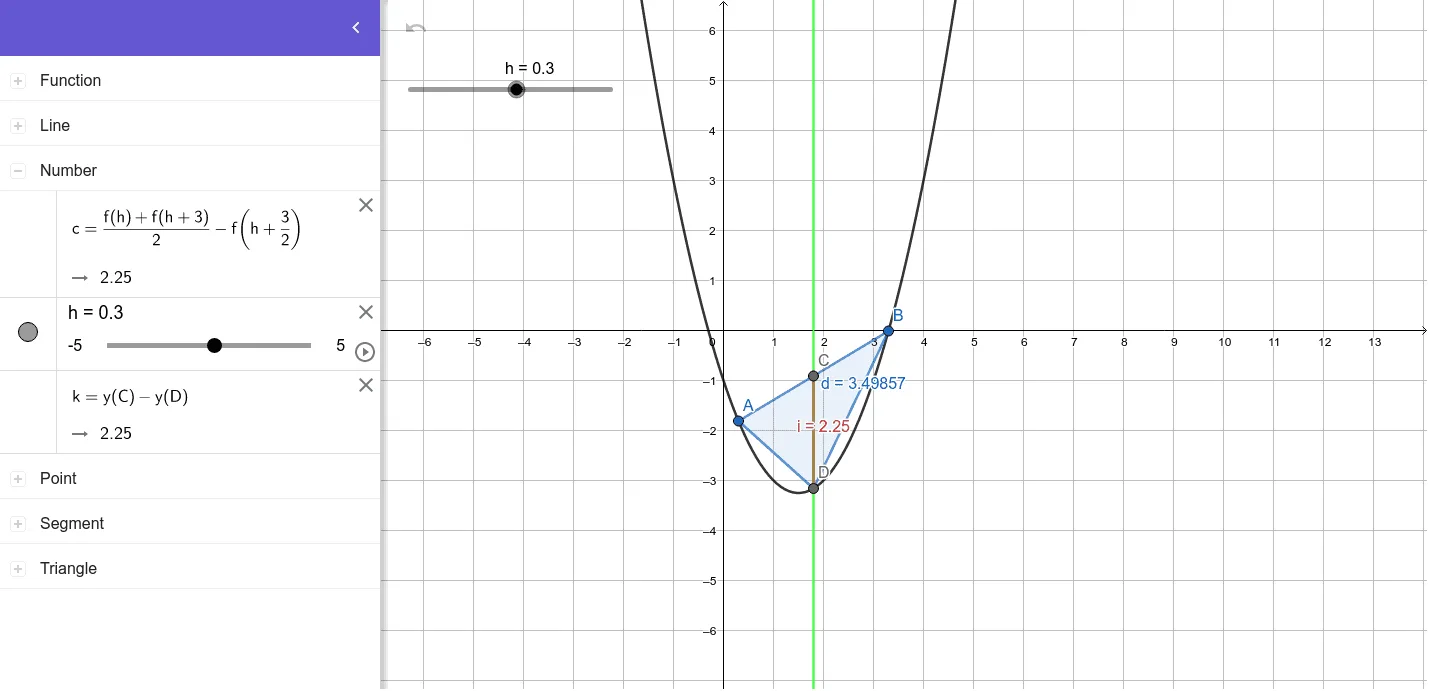
This example demonstrates the geometric relationship and dynamic changes between parabolas and function graphs. Key math concepts include parabolas, functions, analytical geometry, and geometric constructions. Construction highlights involve GeoGebra commands like Midpoint, OrthogonalLine, Intersect, Polygon, and Segment. Suitable for high school mathematics teaching and function graph exploration.
GeoGebra Commands & Parameters
Midpoint(B, A) → COrthogonalLine(C, xAxis) → gIntersect(f, g, 1) → DPolygon(B, D, A) → t1, a, b, dSegment(C, D) → i
AI Drawing Prompt Reference
Draw a parabola and its function graph to illustrate the geometric relationship and dynamic changes between them. First, find the midpoint of a segment, then draw a perpendicular line from this midpoint to the x-axis, which intersects the parabola at a point. Next, connect the midpoint and the intersection point, and form a triangle with these three points. Finally, draw a line segment connecting the midpoint and the intersection point to complete the illustration.
The prompt above was compiled from the original drawing commands and is for reference only.