
Outliers Dependence on q and n
Loading the math board and drawing, please wait…
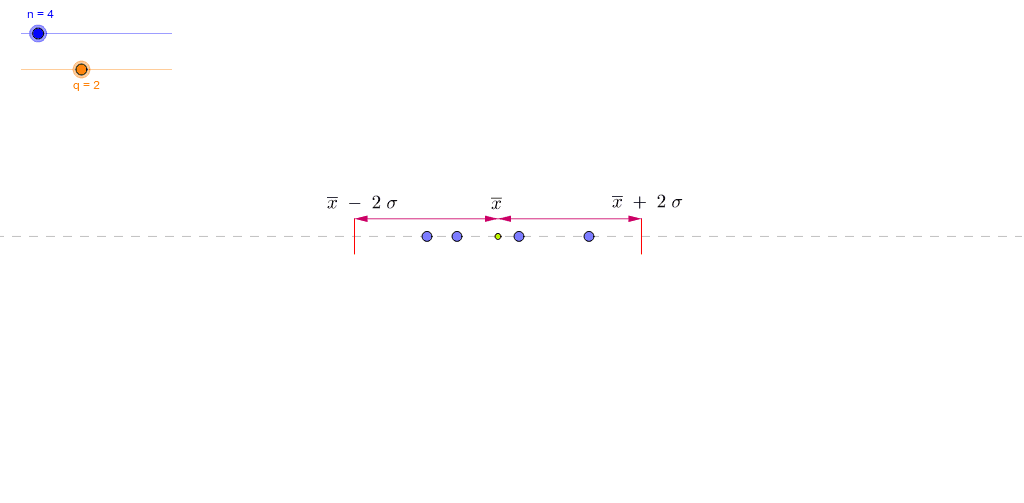
This dynamic construction tests the dependence of outliers on the amount of data and the range around the mean. Key concepts include mean, random experiments, and data distribution. Using GeoGebra commands such as Point, SXX, Sequence, and Mean, the parameters q and n can be dynamically adjusted to observe changes in outliers. Suitable for high school mathematics education and research.
GeoGebra Commands & Parameters
Point(xAxis) → P_{1}Point(xAxis) → P_{4}Point(xAxis) → P_{3}Point(xAxis) → P_{2}SXX({P_{1}, P_{2}, P_{3}, P_{4}}) → SumofSquares_4Point(xAxis) → P_{5}Point(xAxis) → P_{6}Point(xAxis) → P_{7}Point(xAxis) → P_{8}Point(xAxis) → P_{9}Point(xAxis) → P_{10}Point(xAxis) → P_{15}Point(xAxis) → P_{16}Point(xAxis) → P_{17}Point(xAxis) → P_{18}Point(xAxis) → P_{19}Point(xAxis) → P_{20}Point(xAxis) → P_{11}Point(xAxis) → P_{12}Point(xAxis) → P_{13}Point(xAxis) → P_{14}Sequence(x(Object["P_{" + (k) + "}"]), k, 1, n) → LxMean(Lx) → Mean_nSXX(Lx) → SumofSquares_nSegment(LL, HL) → lowSDSegment(LH, HH) → highSDVector(HM, HL) → uVector(HL, HM) → vVector(HM, HH) → wVector(HH, HM) → e