
Nuclear Power Plant Site Optimization
Loading the math board and drawing, please wait…
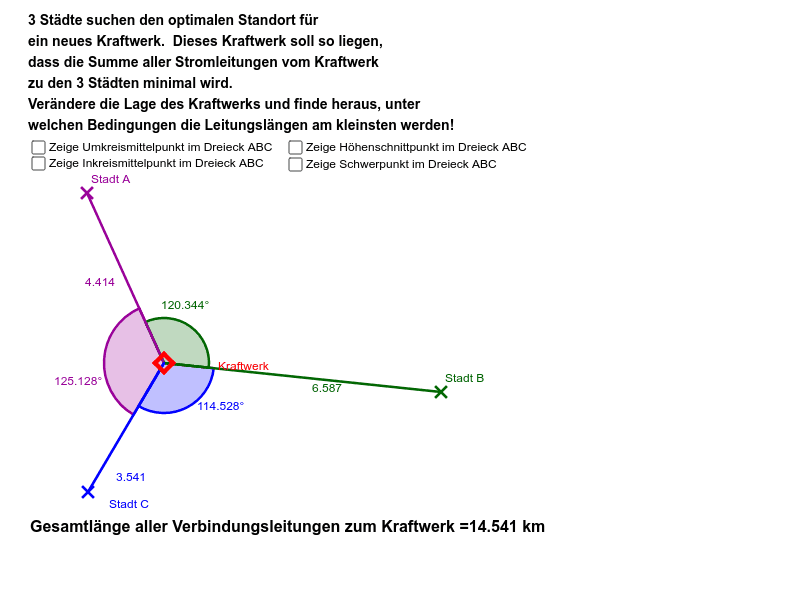
This example demonstrates the optimization of nuclear power plant site selection. Key mathematical concepts include geometric construction and optimization. Using GeoGebra commands such as Segment, Angle, and LineBisector, the example visually illustrates how to find the optimal location through geometric methods. Suitable for high school students and professionals in related fields.
GeoGebra Commands & Parameters
Segment(A, D) → aSegment(D, B) → bSegment(D, C) → cAngle(A, D, C) → αAngle(C, D, B) → βAngle(B, D, A) → γSegment(B, C) → dSegment(C, A) → eLineBisector(e) → fLineBisector(d) → gIntersect(g, f) → M_UOrthogonalLine(B, e) → iOrthogonalLine(A, d) → jIntersect(j, i) → H_SAngularBisector(A, B, C) → lAngularBisector(B, C, A) → mIntersect(m, l) → M_IMidpoint(e) → EMidpoint(d) → F_1Segment(E, B) → pSegment(F_1, A) → qLine(F_1, A) → rLine(E, B) → sIntersect(r, s) → SPolygon(A, B, 3) → Vieleck1, t, a_1, b_1, GPolygon(B, C, 3) → Vieleck2, c_1, b_2, c_2, HPolygon(C, A, 3) → Vieleck3, d_1, c_3, a_2, ISegment(I, B) → e_1Segment(G, C) → f_1Intersect(e_1, f_1) → F
AI Drawing Prompt Reference
Draw a nuclear power plant site optimization model. Start by drawing three points A, B, and C, and connect them to form triangle ABC. Then draw the perpendicular bisectors of AB, BC, and CA, which intersect at points M_I, M_U, and H_S, respectively. Next, draw the angle bisectors l and m, which intersect at point M_I. Finally, draw equilateral triangles Vieleck1, Vieleck2, and Vieleck3 with vertices at B, C, and A, respectively, and find their intersection point F.
The prompt above was compiled from the original drawing commands and is for reference only.