
Norwegian Youth IQ Measurement Analysis
Loading the math board and drawing, please wait…
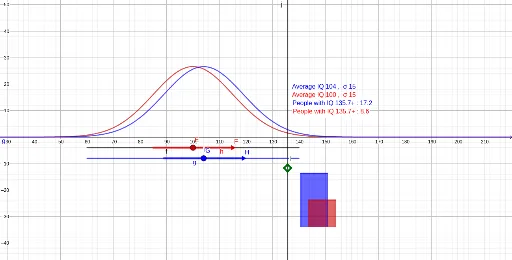
This example demonstrates the analysis of IQ measurements for Norwegian youths during their national service, visualizing IQ distribution through charts. Key math concepts include Normal Distribution, Standard Deviation, Statistics, and Definite Integral. Construction highlights involve GeoGebra commands like Point, Segment, Mirror, OrthogonalLine, Intersect, Vector, Polygon, and Distance. Suitable for high school and above learners to understand statistical graphs and data analysis methods.
GeoGebra Commands & Parameters
Point(Circle[A, 80]) → BSegment(A, B) → fPoint(Circle[C, 80]) → DSegment(C, D) → gPoint(f) → EPoint(f) → FMirror(F, E) → F'Segment(F', F) → hPoint(g) → GPoint(g) → HMirror(H, G) → H'Segment(H, H') → iOrthogonalLine(I, xAxis) → jIntersect(p, j, (135.7049565772696, 1.5523316739609132)) → JIntersect(q, j, (135.7049565772696, 2.84569776614316)) → KOrthogonalLine(I, j) → kVector((0, -20)) → vVector((10, 0)) → uVector((5, -2)) → wPoint(I, w) → LPoint(L, u) → MPoint(L, v) → NPoint(L, Vector[u + v]) → OPolygon(L, N, O, M) → q1, l, n, o, mVector((3, 0)) → aPoint(O, a) → PPoint(N, a) → QVector((0, (20 * α(x(I))))) → bPoint(Q, b) → RPoint(P, b) → SPolygon(R, Q, P, S) → q2, r_1, q_1, p_1, s_1Intersect(j, xAxis) → TDistance(T, J) → distanceTJIntersect(s, j, (135.7049565772696, 17.223717593874312)) → UDistance(T, U) → distanceTUIntersect(r, j, (135.7049565772696, 8.550055667560855)) → VDistance(T, V) → distanceTVDistance(I, Q) → IQ
AI Drawing Prompt Reference
Create a chart visualizing IQ measurements for Norwegian youths, showing a normal distribution curve with standard deviations and statistical values, use definite integrals to indicate data ranges, include multiple points and lines, construct shapes via mirroring and orthogonal lines, and form polygons to represent data intervals.
The prompt above was compiled from the original drawing commands and is for reference only.